
Angel Rubio — arubio@urnerbarry.com
Andrei Rjedkin — arjedkin@urnerbarry.com
Executive Summary
The U.S. shrimp market experienced a downward price trend for nearly 14 months. To provide some context from our previous report, shrimp imports, which account for over 85% of all shrimp supply in the U.S., increased by 20 percent year over year in 2021. Such a figure represents a significant increase from a record high reached just the year prior when the pandemic caused significant disruptions to how consumers eat shrimp in the U.S. Therefore, with imports adjusting considerably lower starting in Q2 of 2022 amid falling prices, one can safely assume that such decreases were insufficient to counter a downward price trend through February 2023. As a result, such a trend also led us to the final empirical conclusion: inventories were ample. Given the lack of available hard data, we delved into calculating inventory numbers with moderately good results. The model suggests prices could bottom out in Q1 ‘23 and then show a very modest rebound afterward.
Key findings
- Estimated inventories, as a function of price elasticity and imports, appear to be a relatively good indicator of future prices.
- Inventories with a lead time between 9 and 12 months had a strong negative correlation with prices before the pandemic started; if inventories were heavy, one could expect discounts and vice-versa.
- Since the pandemic began through approximately Q3 ‘22, these correlations were positive.
- We expect these correlations to be negative in 2023.
- Shrimp imports counterfactual trends suggest imports were ample given the level of demand from 2021 to 2022.
- Estimated inventories suggest volumes became burdensome around Q3-Q4 2021 through Q3 2022.
- Estimated inventories suggest 2023 began with levels similar to 2017-2019.
- Shrimp prices appear to have found a bottom—at least temporarily.
- We expect imports to resume their normal seasonal behavior throughout 2023
- We expect prices to stabilize and potentially rebound, although the latter might be modest.
Imports’ growth and counterfactual
As expected, shrimp imports had been trending higher year-over-year post-EMS, given production and population growth. But to show how large imports were for much of 2021 and into early 2022, relative to historical trends, one must show a counterfactual argument. Therefore, we calculated two counterfactual trends: one which assumed historical pre-pandemic growth and another that assumed a structural change post-EMS correction from 2016 through 2022, which adjusts for the pent-up demand seen in 2021. We found that imports in 2021 and early 2022 were significantly above optimistic and moderate growth models, potentially suggesting that inventories were ample for much of 2022.
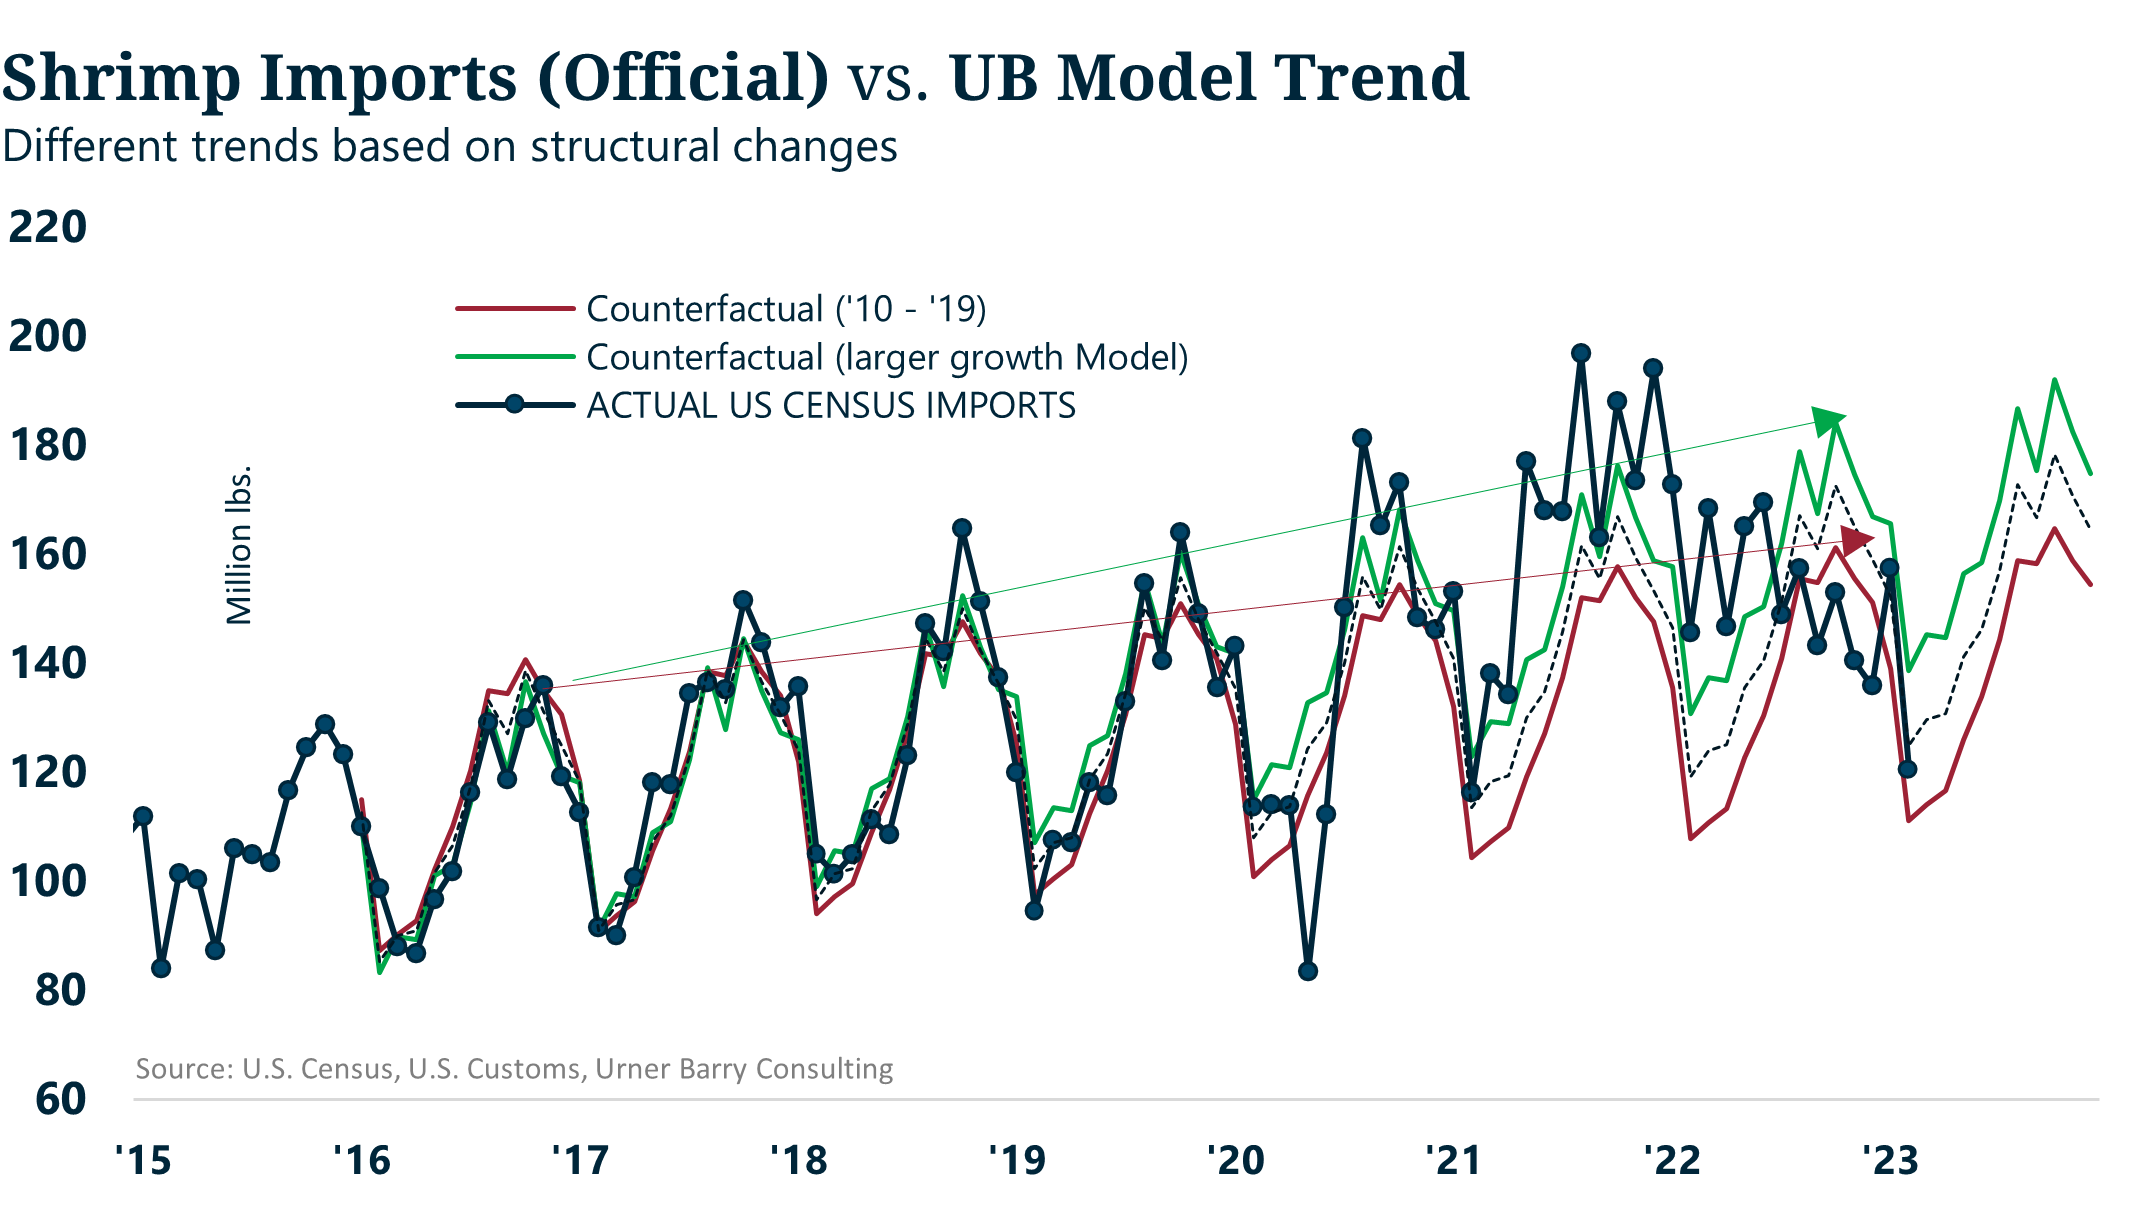
Figure 1. Monthly shrimp imports vs. counterfactual models. Source: U.S. Customs, Urner Barry Consulting.
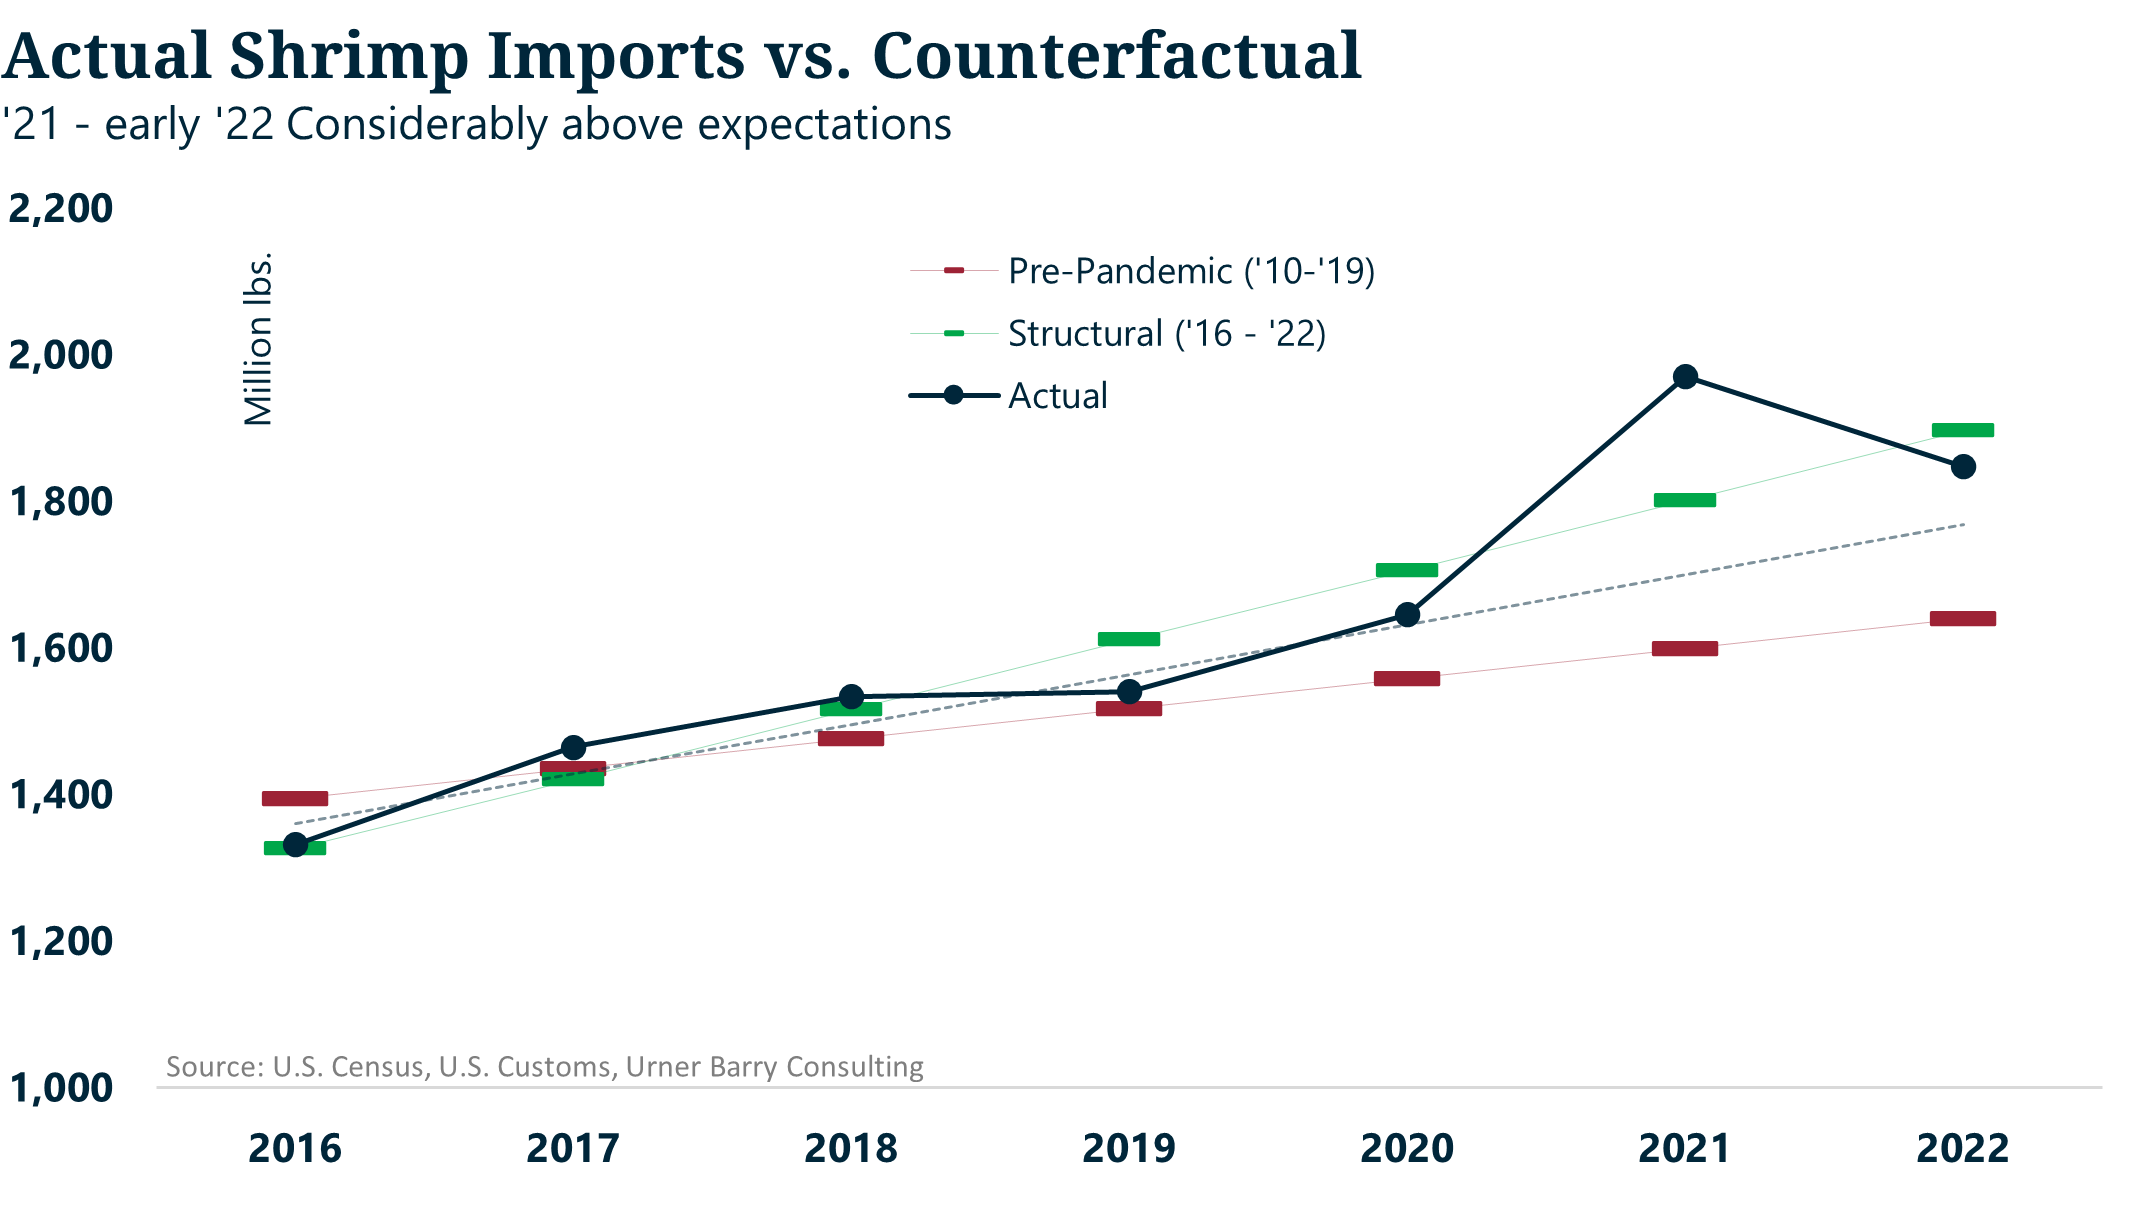
Figure 2. Yearly shrimp imports vs. counterfactual models. Source: U.S. Customs, Urner Barry Consulting.
Inventory
Since most of this shrimp is frozen, we cannot assume that all the shrimp is “consumed” when calculating per capita consumption for any given period. In other words, we must always factor in potential ending inventories. Unfortunately, there is no hard inventory data for shrimp, although anecdotal reports suggested inventories were heavy for much of 2022. Still, we delved into trying to estimate these inventories as a function of price changes and imports over time. In other words, we estimated potential inventory “clearance” as a function of price elasticity and imports while making some assumptions based on historically lagged correlations.
Although this indicator is still in beta, it threw moderately good results. Because we assume that inventories are a function of imports and prices, logical thinking would suggest that prices would head in the opposite direction relative to inventories.
In our previous paper, we used imports as a proxy for price movement, assuming that importers would purchase more volume as demand in the U.S. strengthened and less when it weakened—naturally, with a lag. The premise for inventories is for importers to adjust prices accordingly; if inventories got heavy, importers would discount, and as inventories got thin, importers would increase prices. The model suggests that carry-over inventories in 2021 into 2022 were quite heavy. It also suggests that as imports lower starting in Q2 of 2022, those heavy inventories decreased month-over-month but not year-over-year until sometime in Q4 2022. Such an estimate suggests that shrimp sales during the second half of ’22 were considerably lower compared to the previous year.
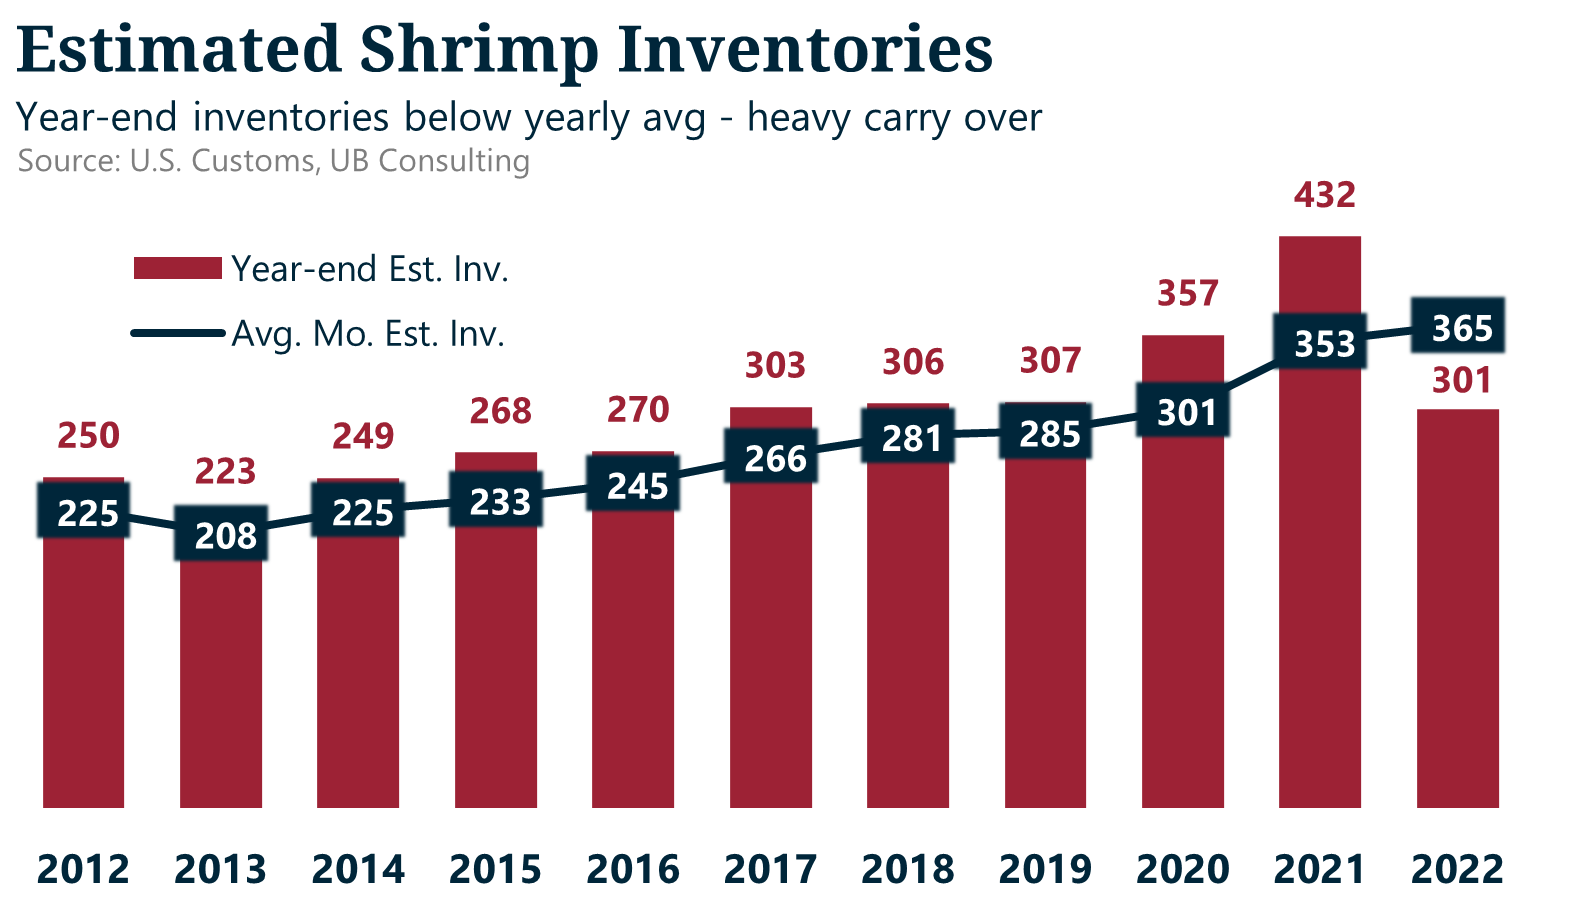
Figure 3. Estimated year-end and avg. mo. shrimp inventories; model is calculated on a monthly basis from an estimated “clearance” rate. Source: U.S. Customs, Urner Barry Consulting.
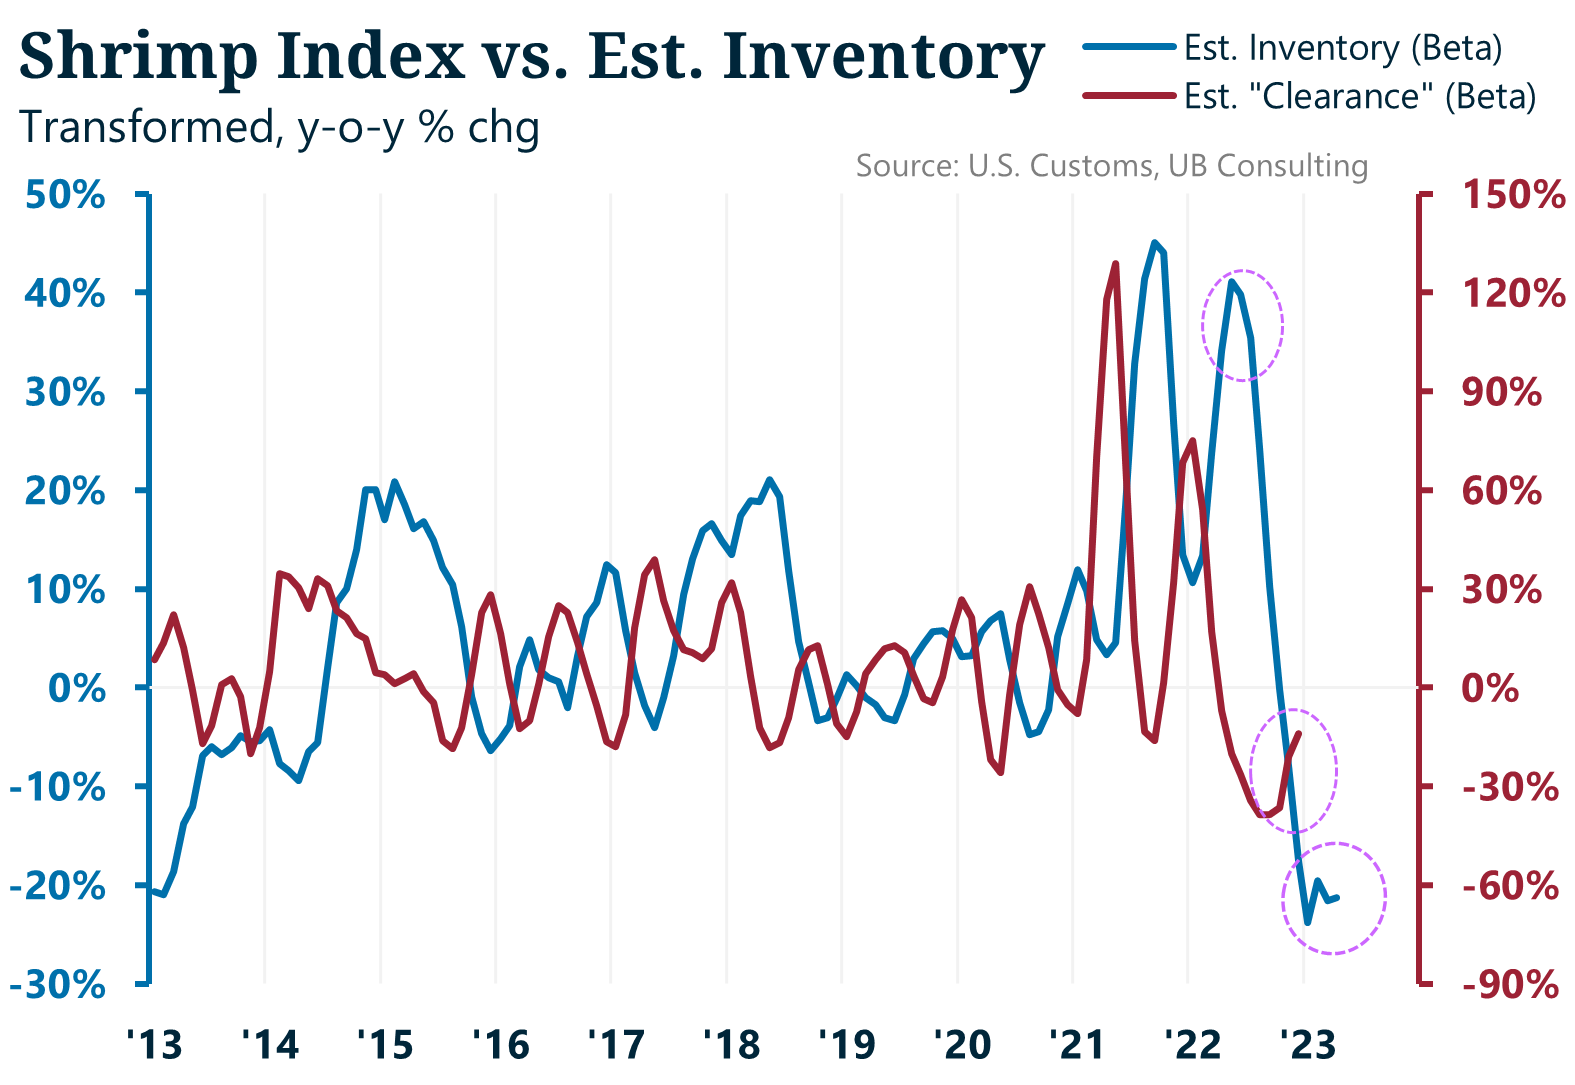
Figure 4. Year-over-year estimated monthly shrimp inventories vs. estimated “clearance” rate. Source: U.S. Customs, Urner Barry Consulting.
Imports
The problem with the estimates above is that it doesn’t consider potential offerings from overseas, which could also motivate importers to move prices in the same direction.
For the sake of simplicity, we will use the former two—imports and inventories—since replacement offering prices are not available, even though we have used import price per pound as a proxy in the past. As shown in figures 3-4, the basic premise in the future is that given that estimated inventories appear to have plunged into the first two months of 2023, prices should theoretically find a bottom sooner rather than later. And the reason is relatively simple: imports have been on a downward and counter-cyclical trend, which, over time, should provide balance relative to demand.
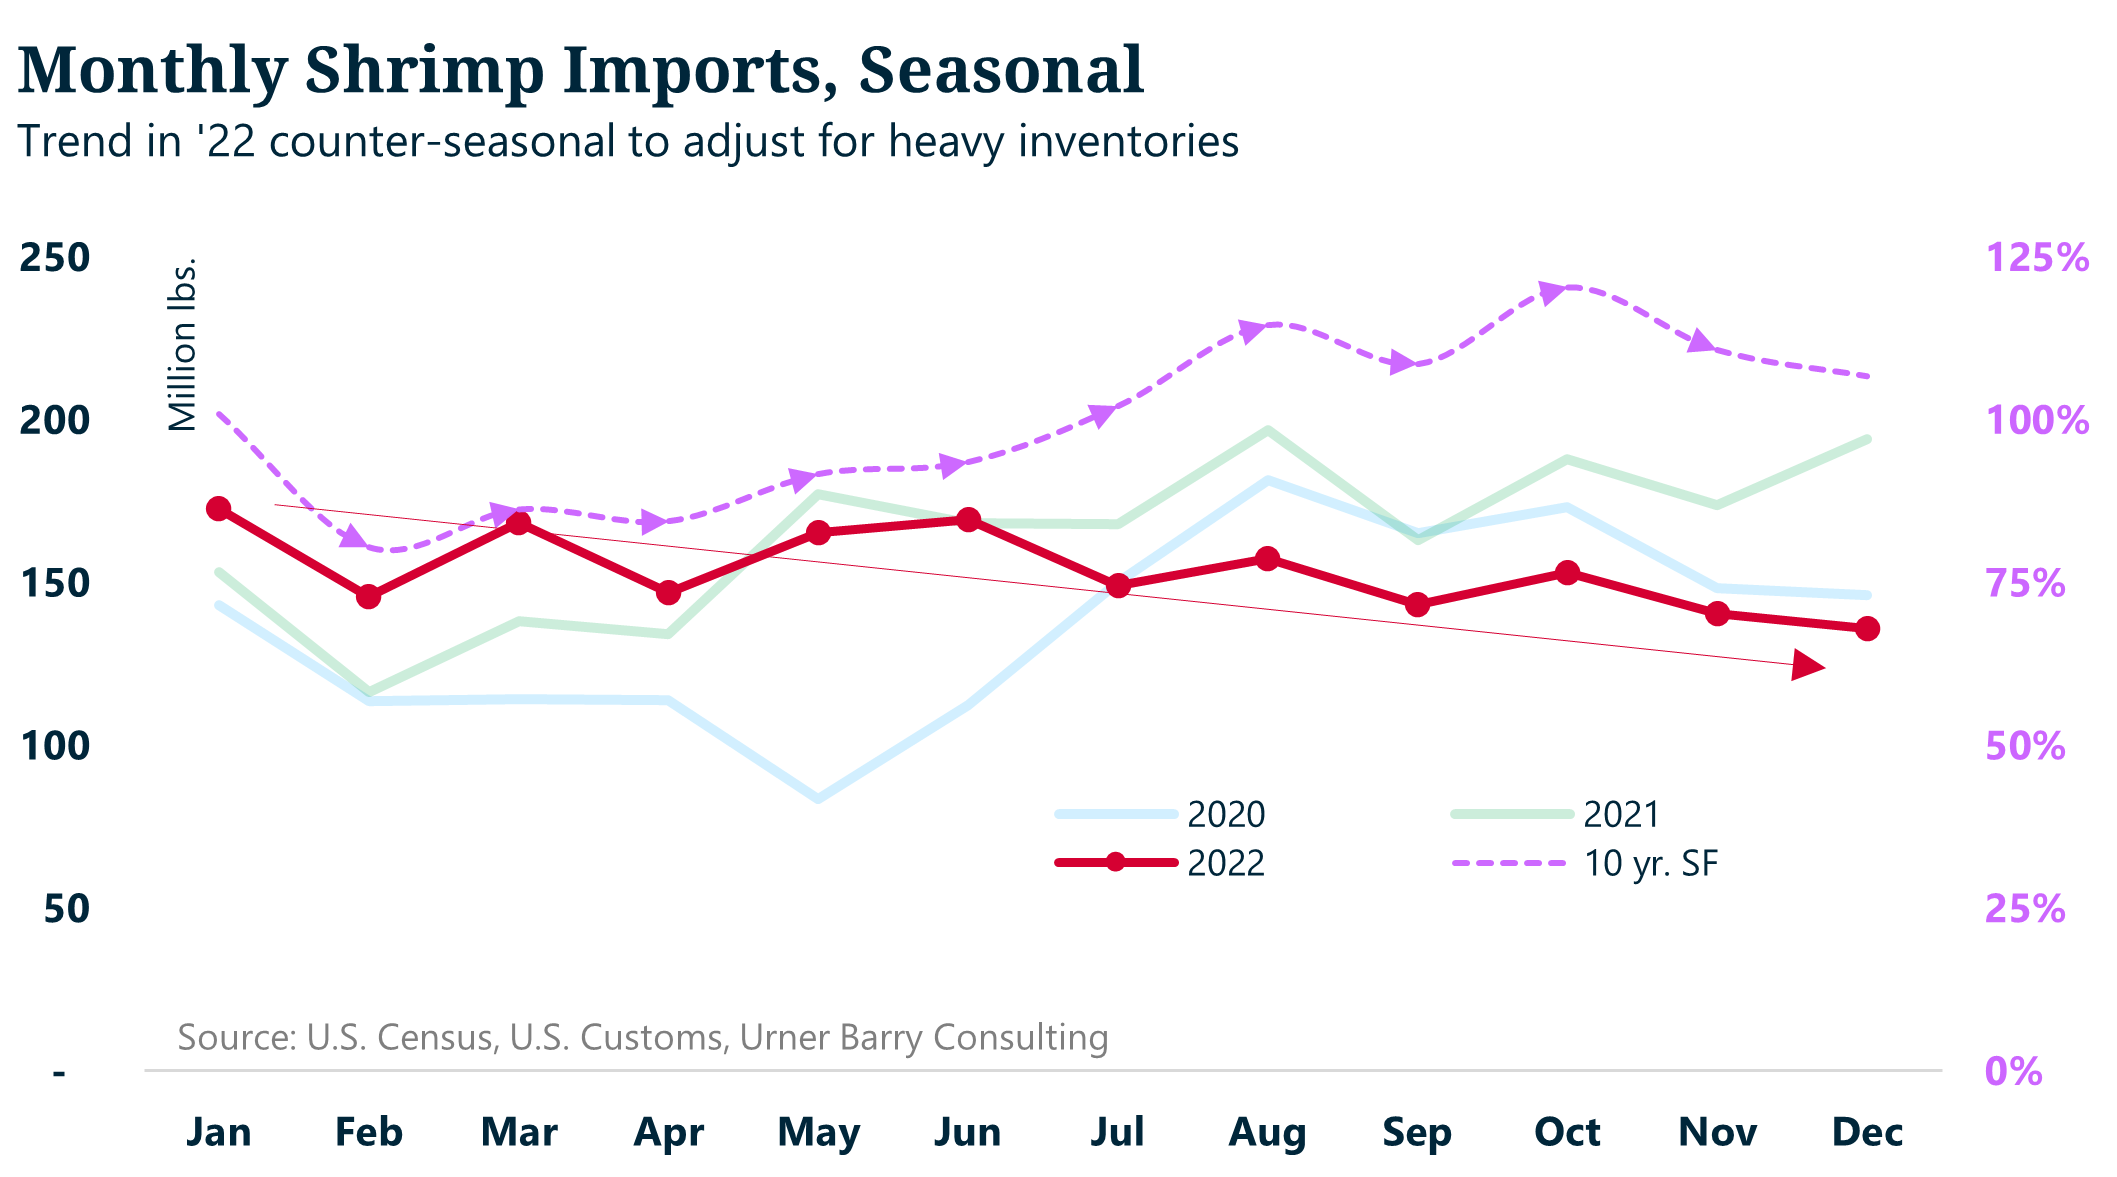
Figure 5. Monthly seasonal shrimp imports vs. historical seasonal factor. Source: U.S. Customs, Urner Barry Consulting.
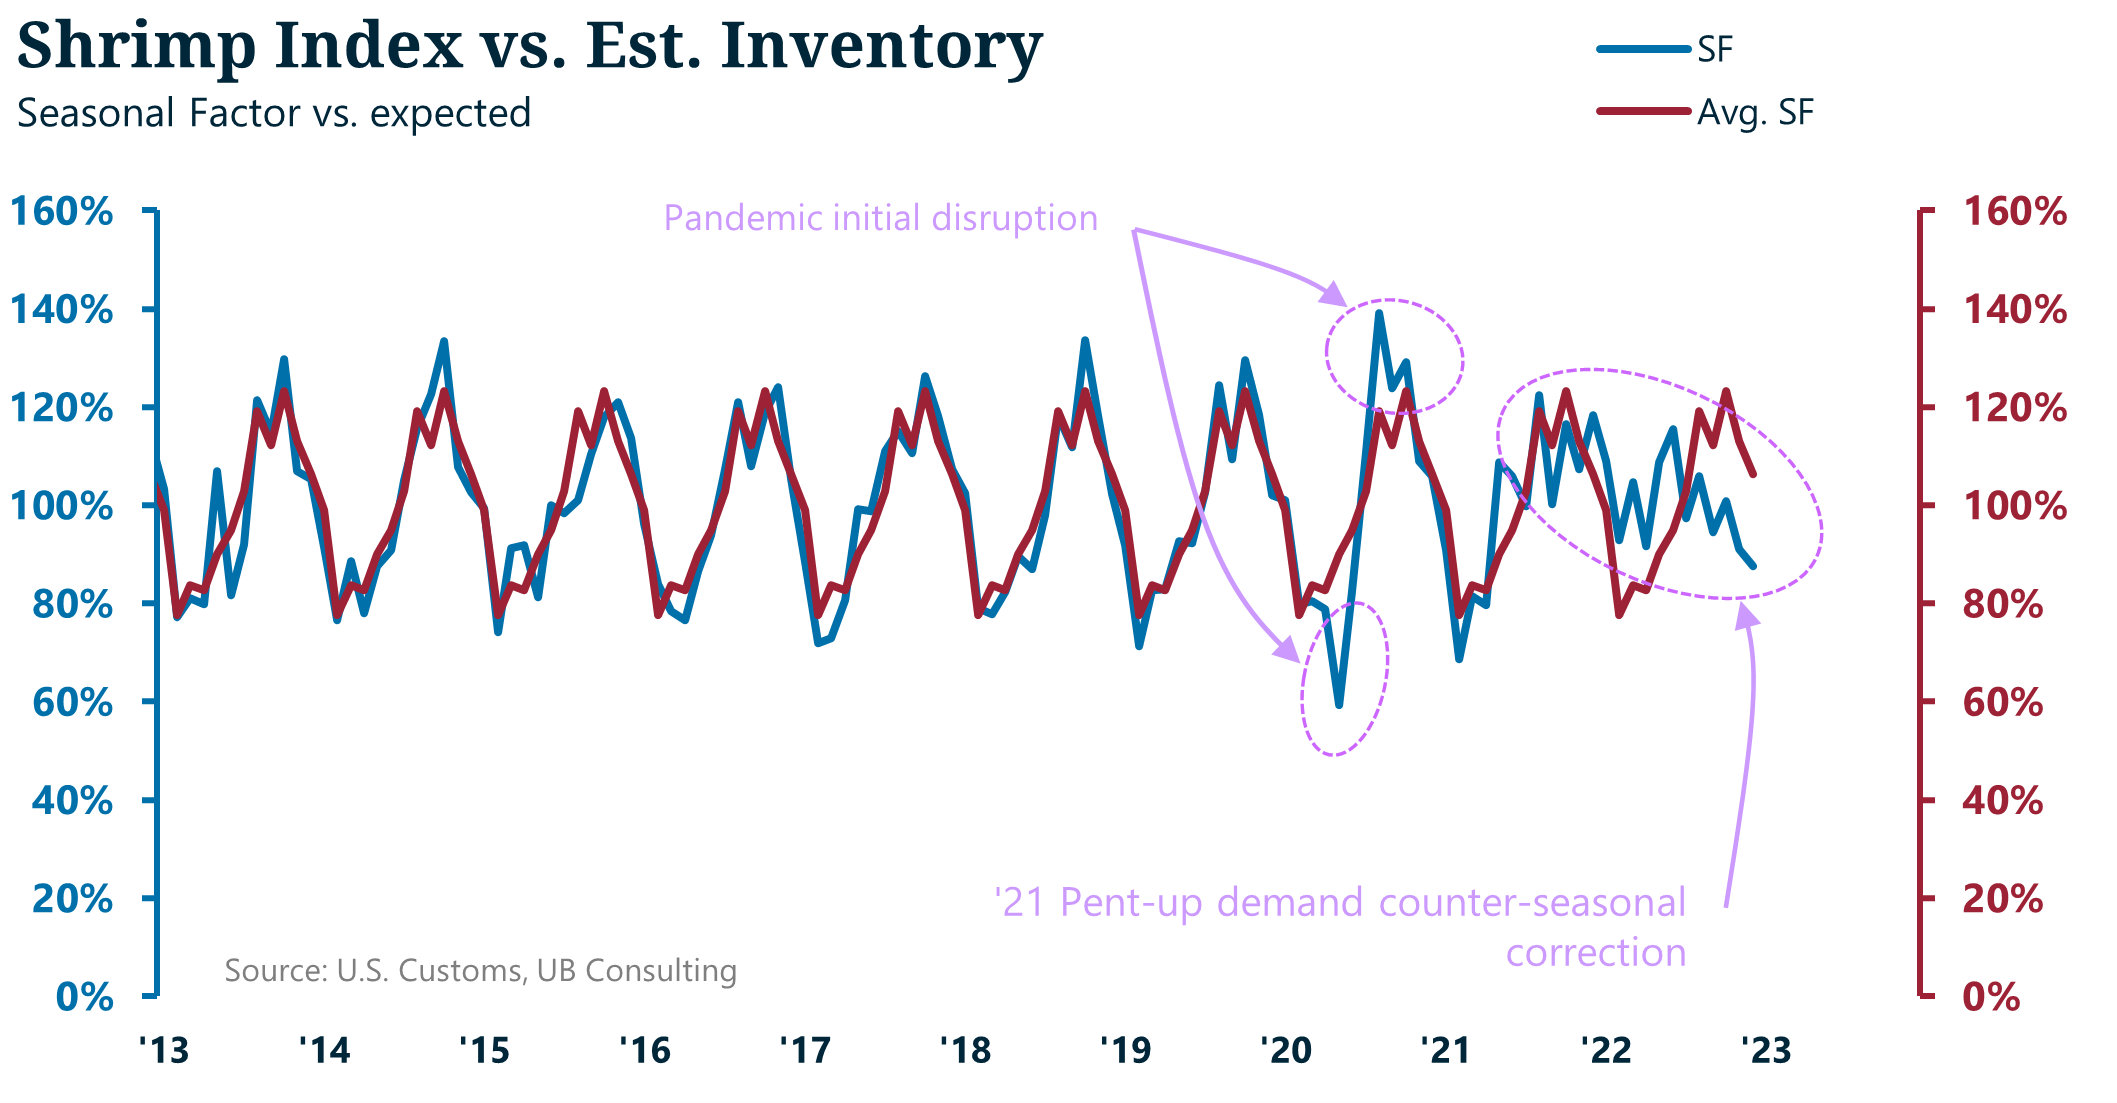
Figure 6. Monthly contiguous shrimp imports vs. historical seasonal factor. Source: U.S. Customs, Urner Barry Consulting.
Consumption per capita
Considering the import and inventory models, which suggest that prices could have found a new equilibrium point, we can now estimate consumption per capita. We estimated such figures on a seasonal basis using imports, our estimates for inventory, and their relationship with real prices (nominal prices adjusted for inflation) through February 2023 (figure 7). Our models suggest an increase of 15 percent in per capita consumption during 2021 despite inventories growing by approximately 17 percent. It also suggests that consumption per capita remained strong in 2022 amid lower prices; the caveat is that imports had to adjust lower to drive down inventories and stop prices from moving lower. It is also likely, that, given the adjustment in imports so that supplies can find a balance with prices, we could see consumption per capita fall in 2023.
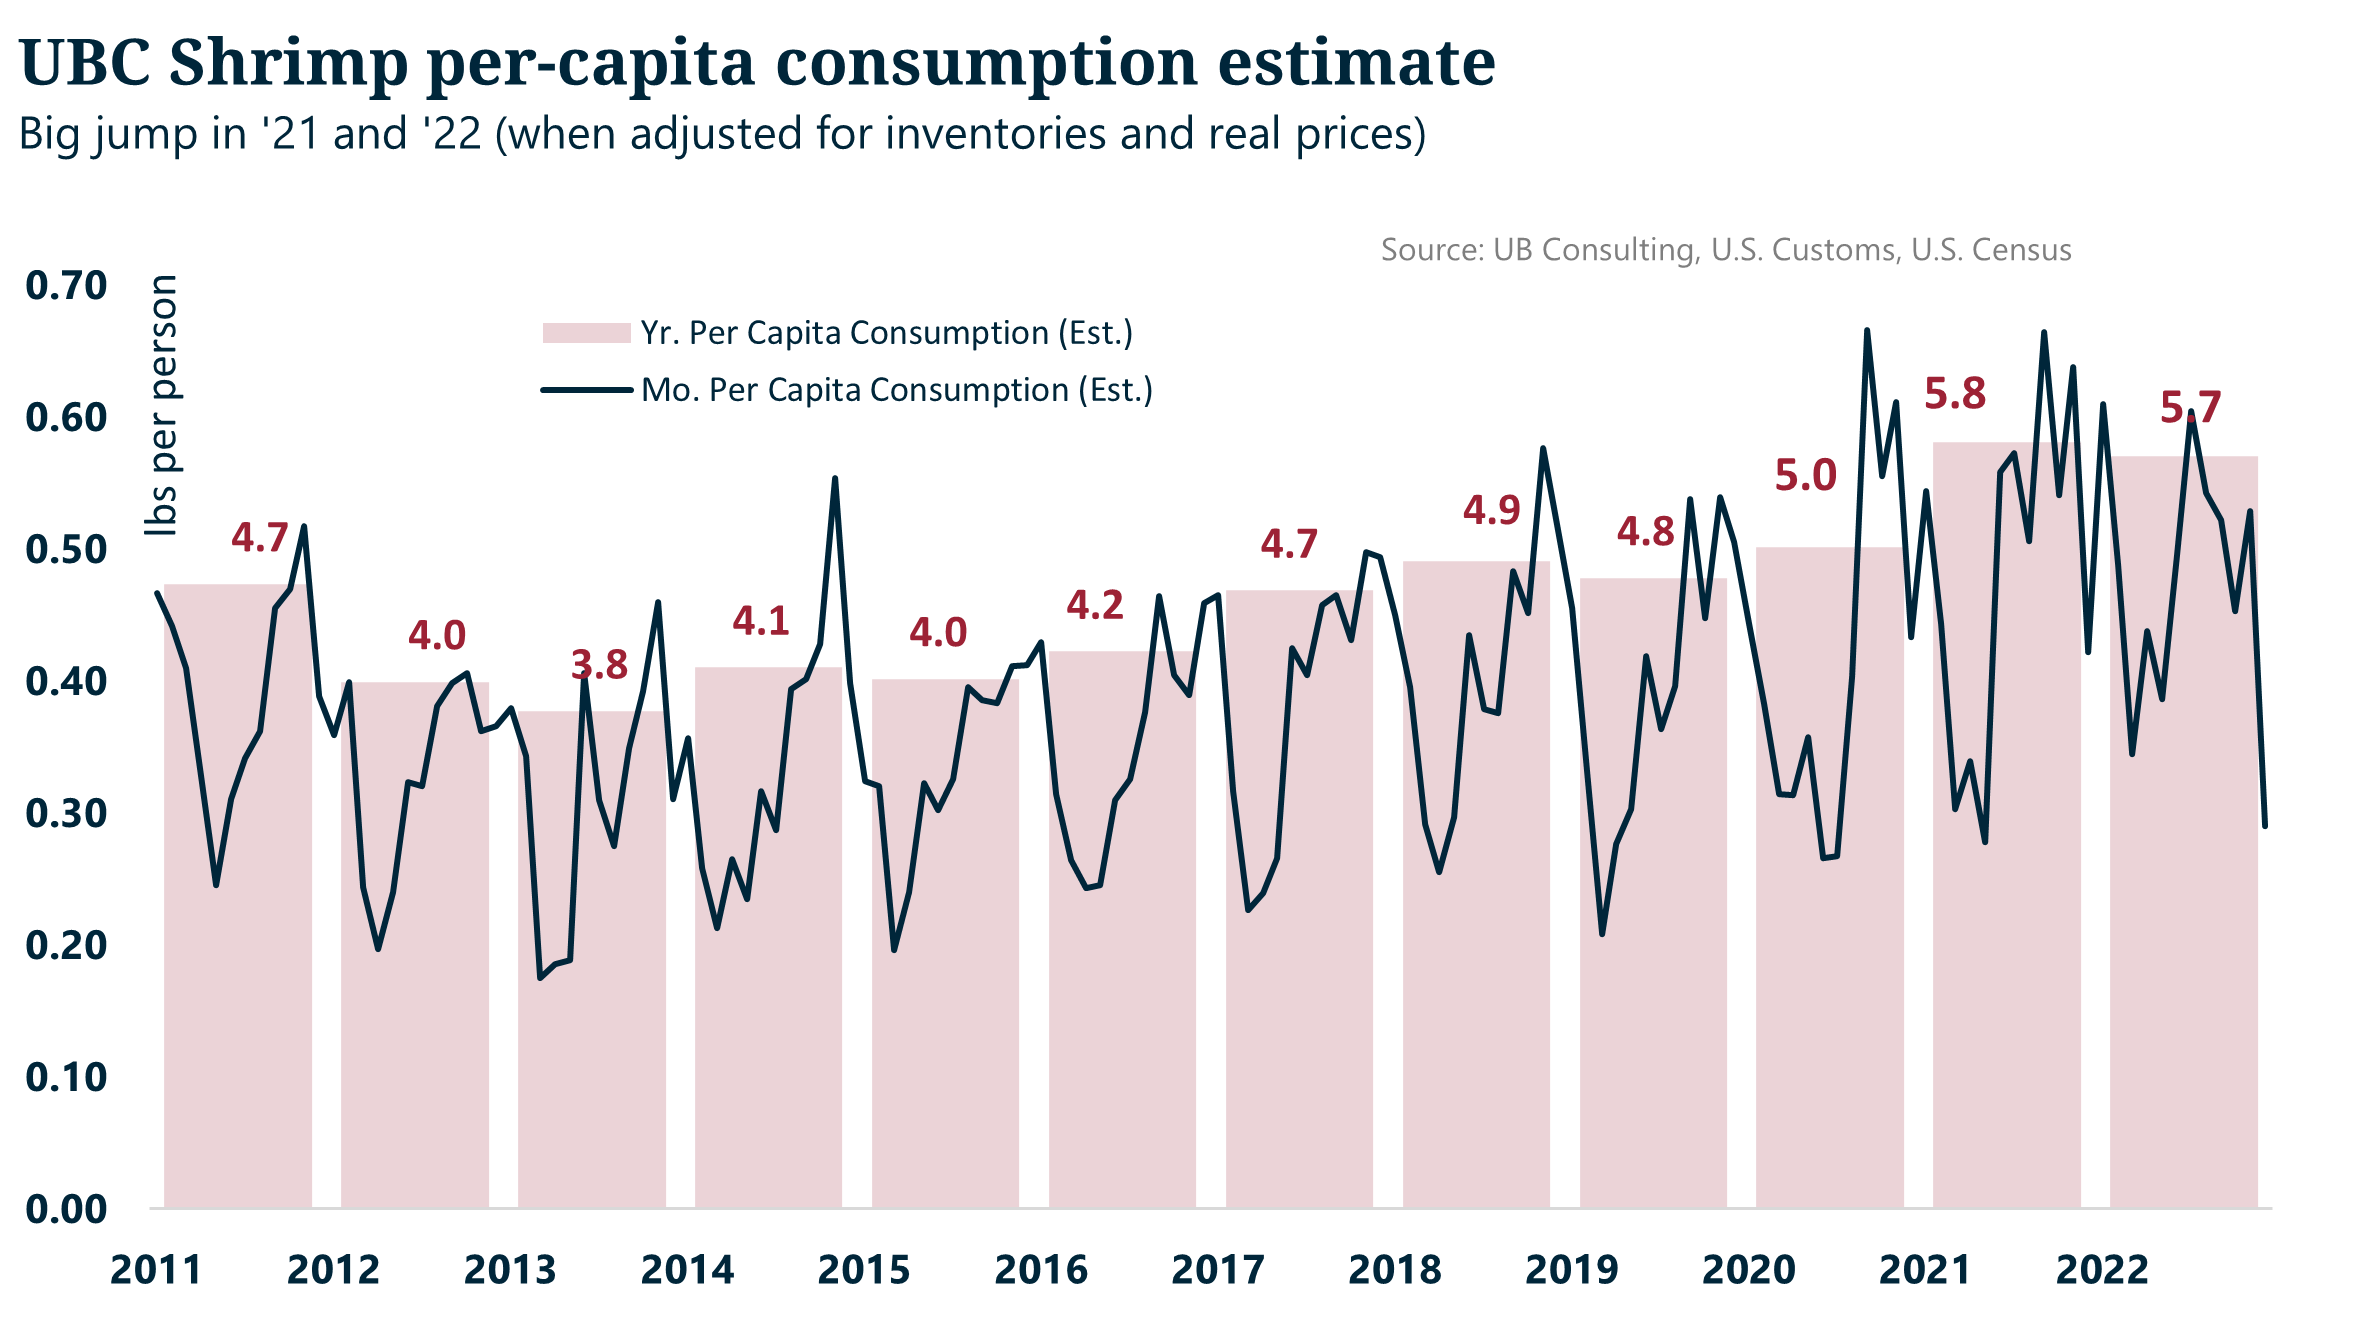
Figure 7. Monthly and yearly estimated shrimp consumption per capita. Source: U.S. Census, Urner Barry Consulting.
Imports’ forecast
In addition, we forecast imports for January and February 2023 using available U.S. Customs data. These estimates suggest a 9 and 17 percent contraction compared to January and February last year (figures 8-9). However, as mentioned earlier, imports in early 2022 reached a seasonal record high, so comparing those numbers could be misleading. Therefore, if we compare these numbers to the counterfactual presented earlier, shrimp imports in January and February of 2023 would be within the expected estimated growth, further suggesting that inventories appear to be finding a balance. To provide some context about these import forecasts, our model has been, on average, 99.8 percent accurate in predicting imports with a 4.6 percent error since we began reporting such figures in April 2020.
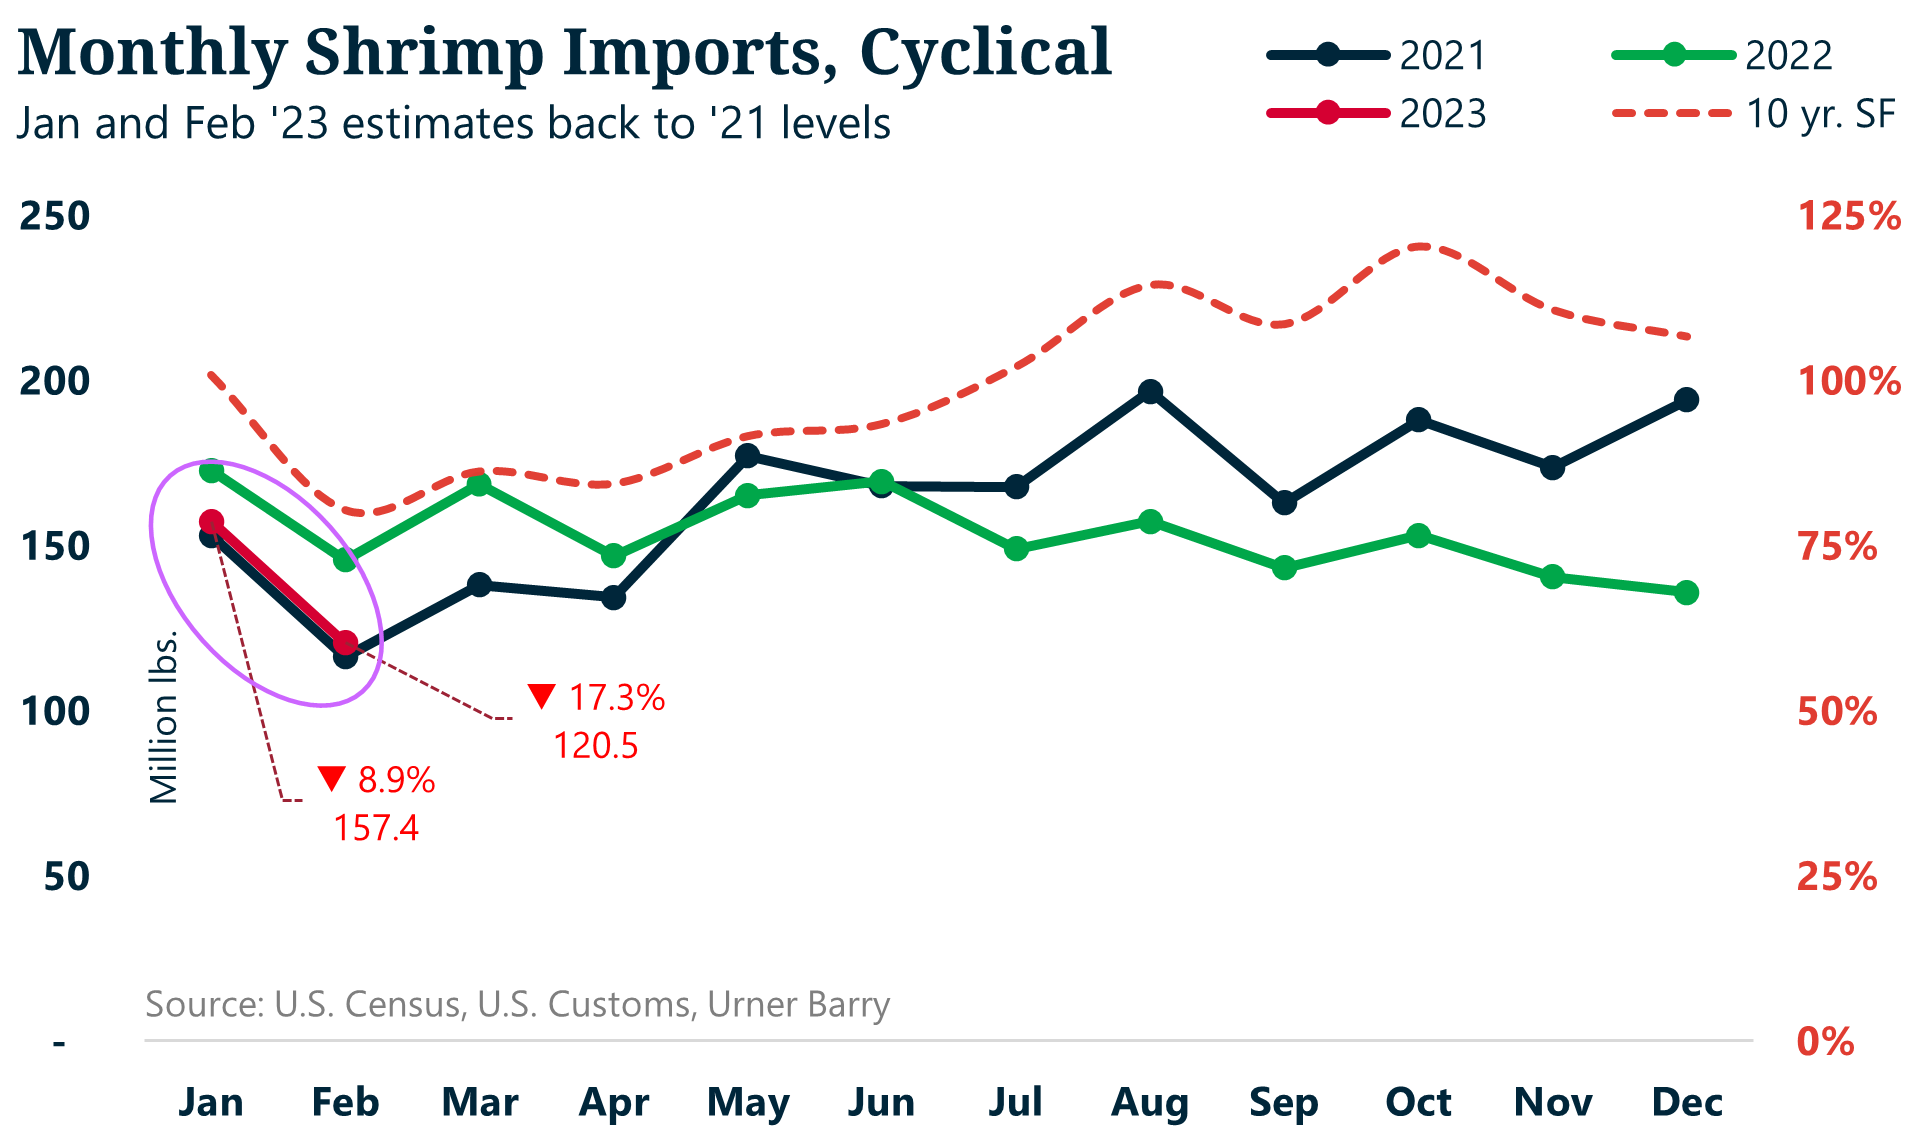
Figure 8. Monthly shrimp imports + Jan-Feb ‘23 U.B. Consulting forecasts. Source: U.S. Customs, Urner Barry Consulting.
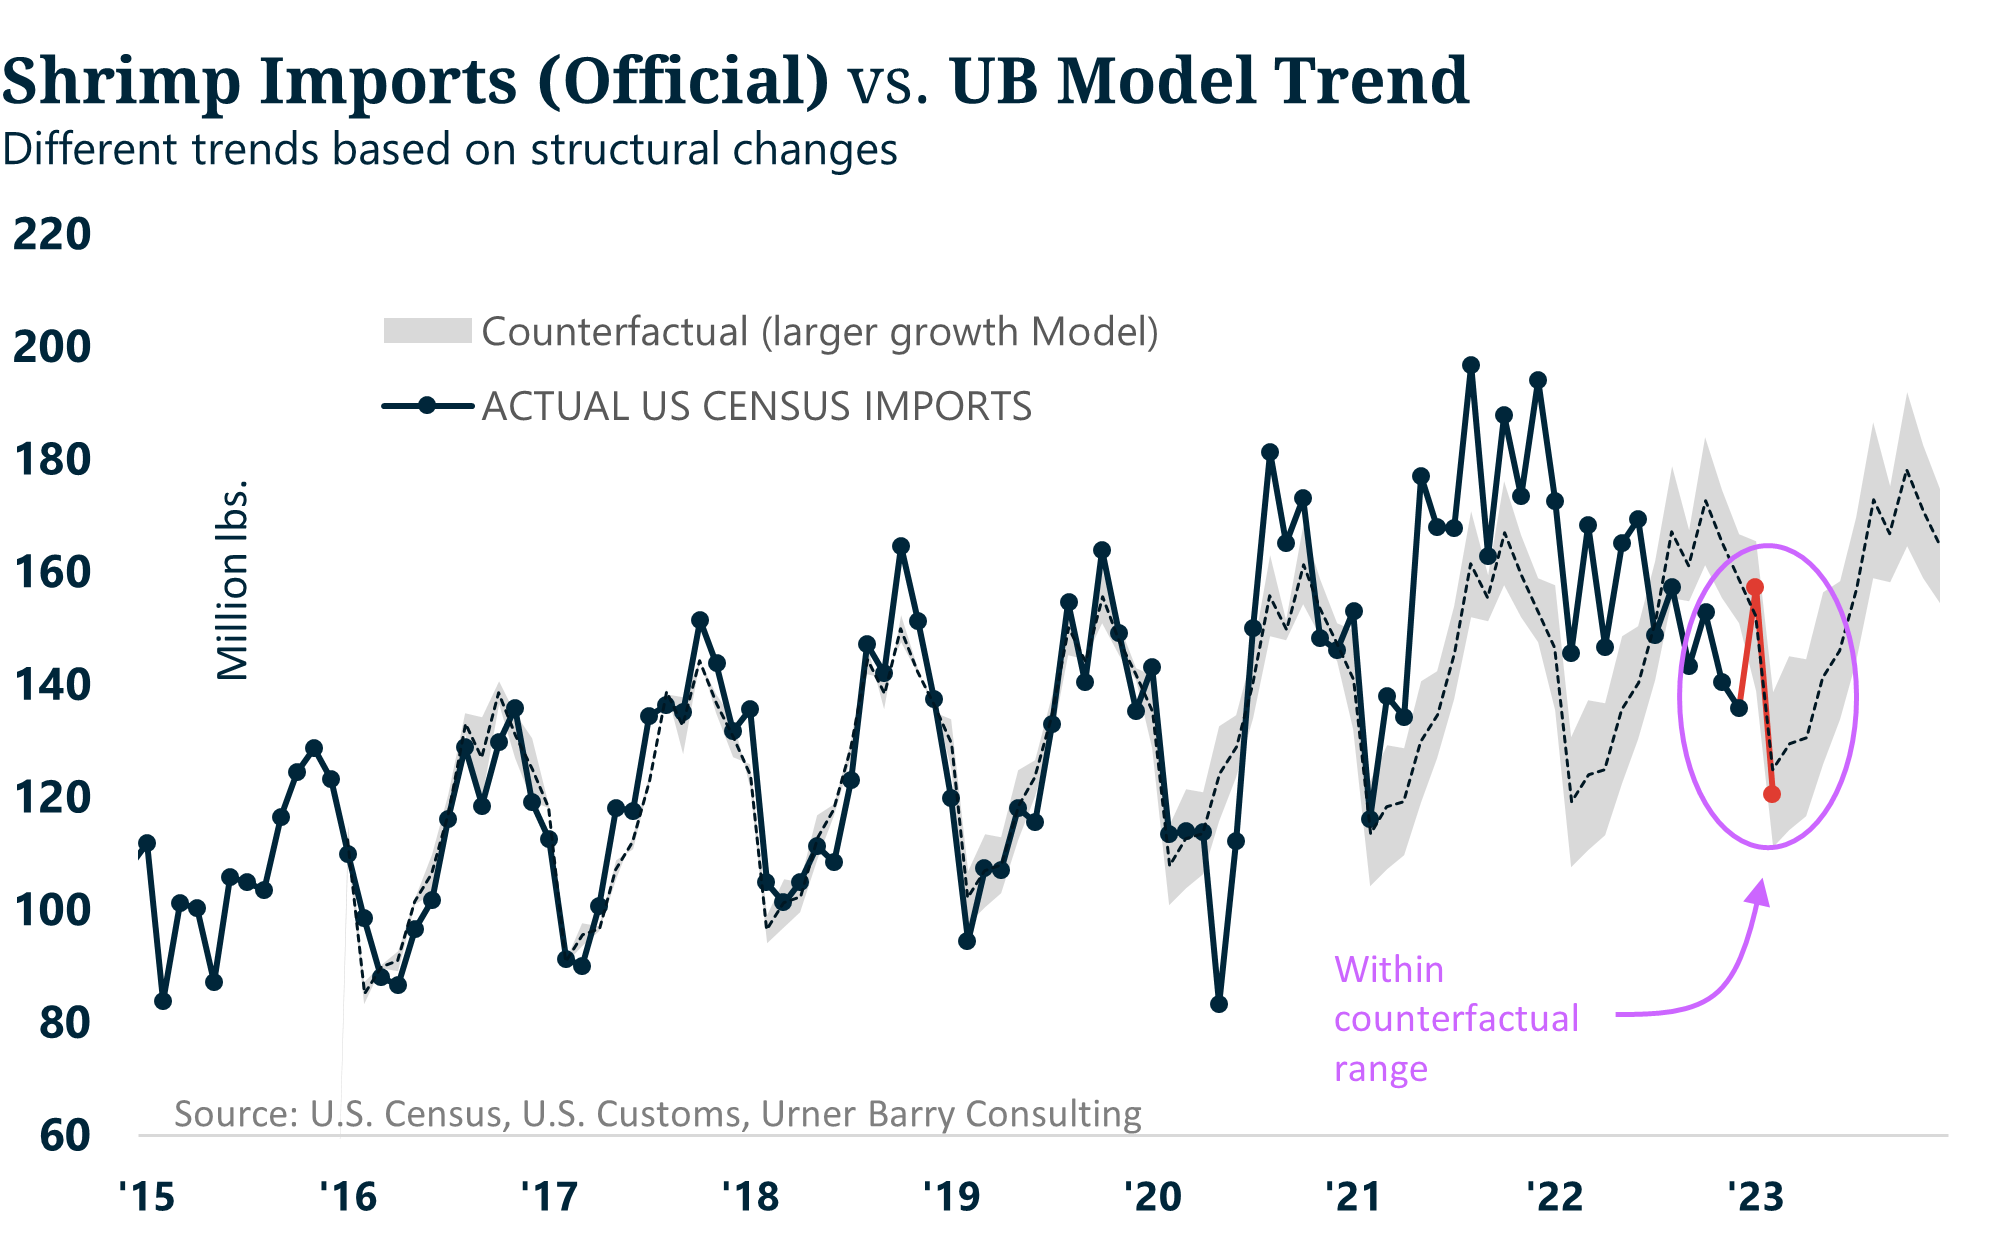
Figure 9. Monthly shrimp imports + Jan-Feb ‘23 UBC forecasts + counterfactual. Source: U.S. Customs, Urner Barry Consulting.
Correlations
Finally, we also delved into price forecasting using these estimated inventory figures. Although the results were moderately good but not as good as the previous model—from our previous paper—these suggested that overall U.S. prices would find a floor in early 2023. Because the shrimp market has experienced a series of supply shocks, we divided the models into different periods where structural changes occurred. For example, one would think the relationship between inventories and imports relative to price would be negative, such as simple supply and demand curves (figure 10). However, this has not always been the case, particularly since the pandemic (figure 11), when prices and imports increased year-over-year. We expect this relationship to invert once again in 2023.
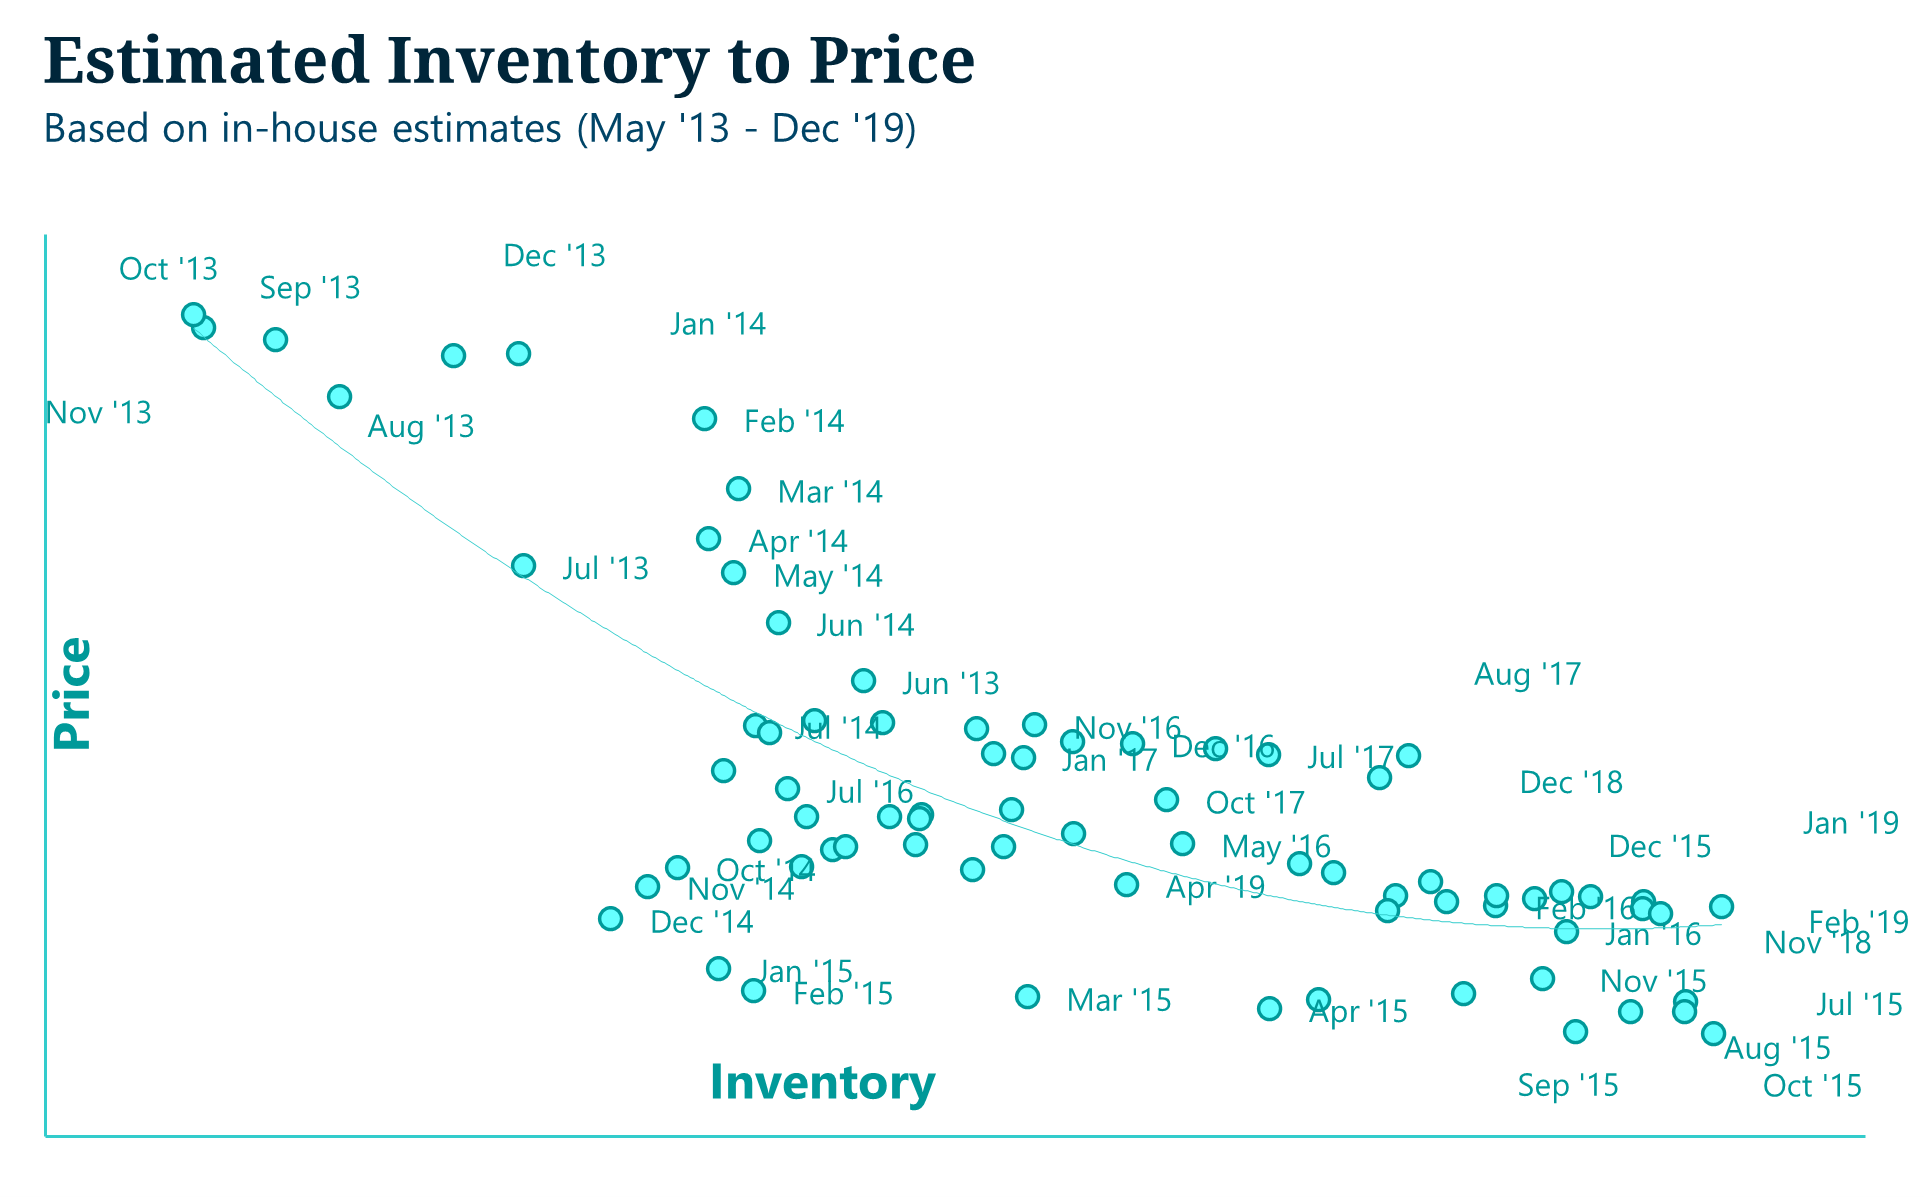
Figure 10. Transformed price and estimated inventories data using Urner Barry’s shrimp indexes (pre-pandemic). Source: U.S. Customs, Urner Barry Consulting.
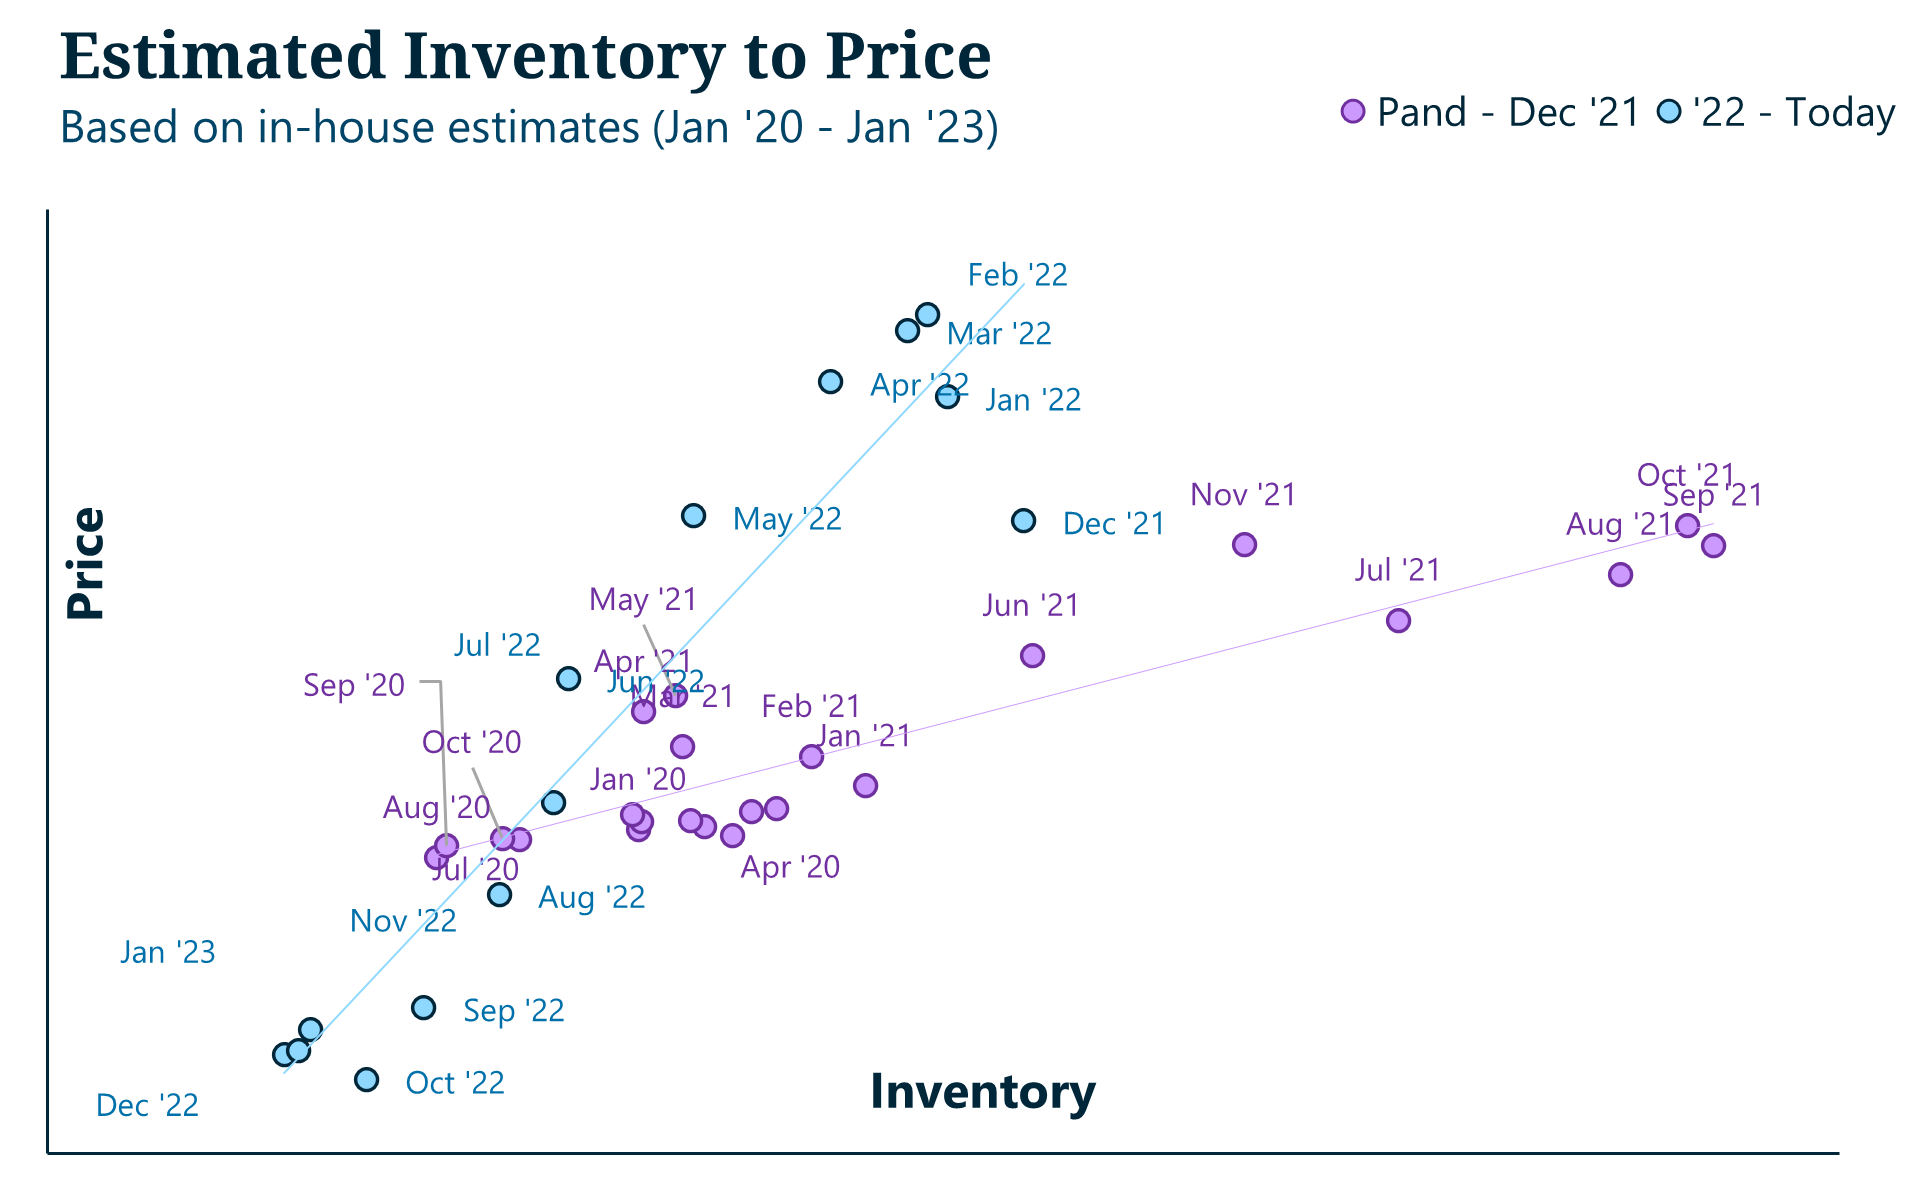
Figure 11. Transformed price and estimated inventories data using Urner Barry’s shrimp indexes (pandemic – today). Source: U.S. Customs, Urner Barry Consulting.
Conclusions - Forecasts
Inventories can provide powerful insights given that these estimates are a leading indicator and can suggest where prices could go, at least trend-wise. Although there are considerable limitations to only using one variable to explain price variation, this model is moderately accurate when predicting a trend but may fail to predict specific months. The latter is due to many reasons, primarily because these estimates rely only on price and import variations “on average,” while inventory time holdings can change suddenly.
Compared to the import model, the trend is similar. Regardless of the model, while a rebound is expected, this will likely be modest. However, we must take these models for what they are: an attempt to explain past behavior to better understand what is likely to happen in the future. We believe the U.S. shrimp market is finally finding its footing after 14 straight months of weak prices.
Further, we must not dismiss the many exogenous factors hammering markets worldwide, from geo-political conflicts to the odds of recession and persistently high inflation. As it stands, it appears that only outside factors can move the needle in any significant manner. In the meantime, most indicators point to a challenging yet “return-to-normal” year for the U.S. shrimp industry; we hope to be proven wrong on the former.
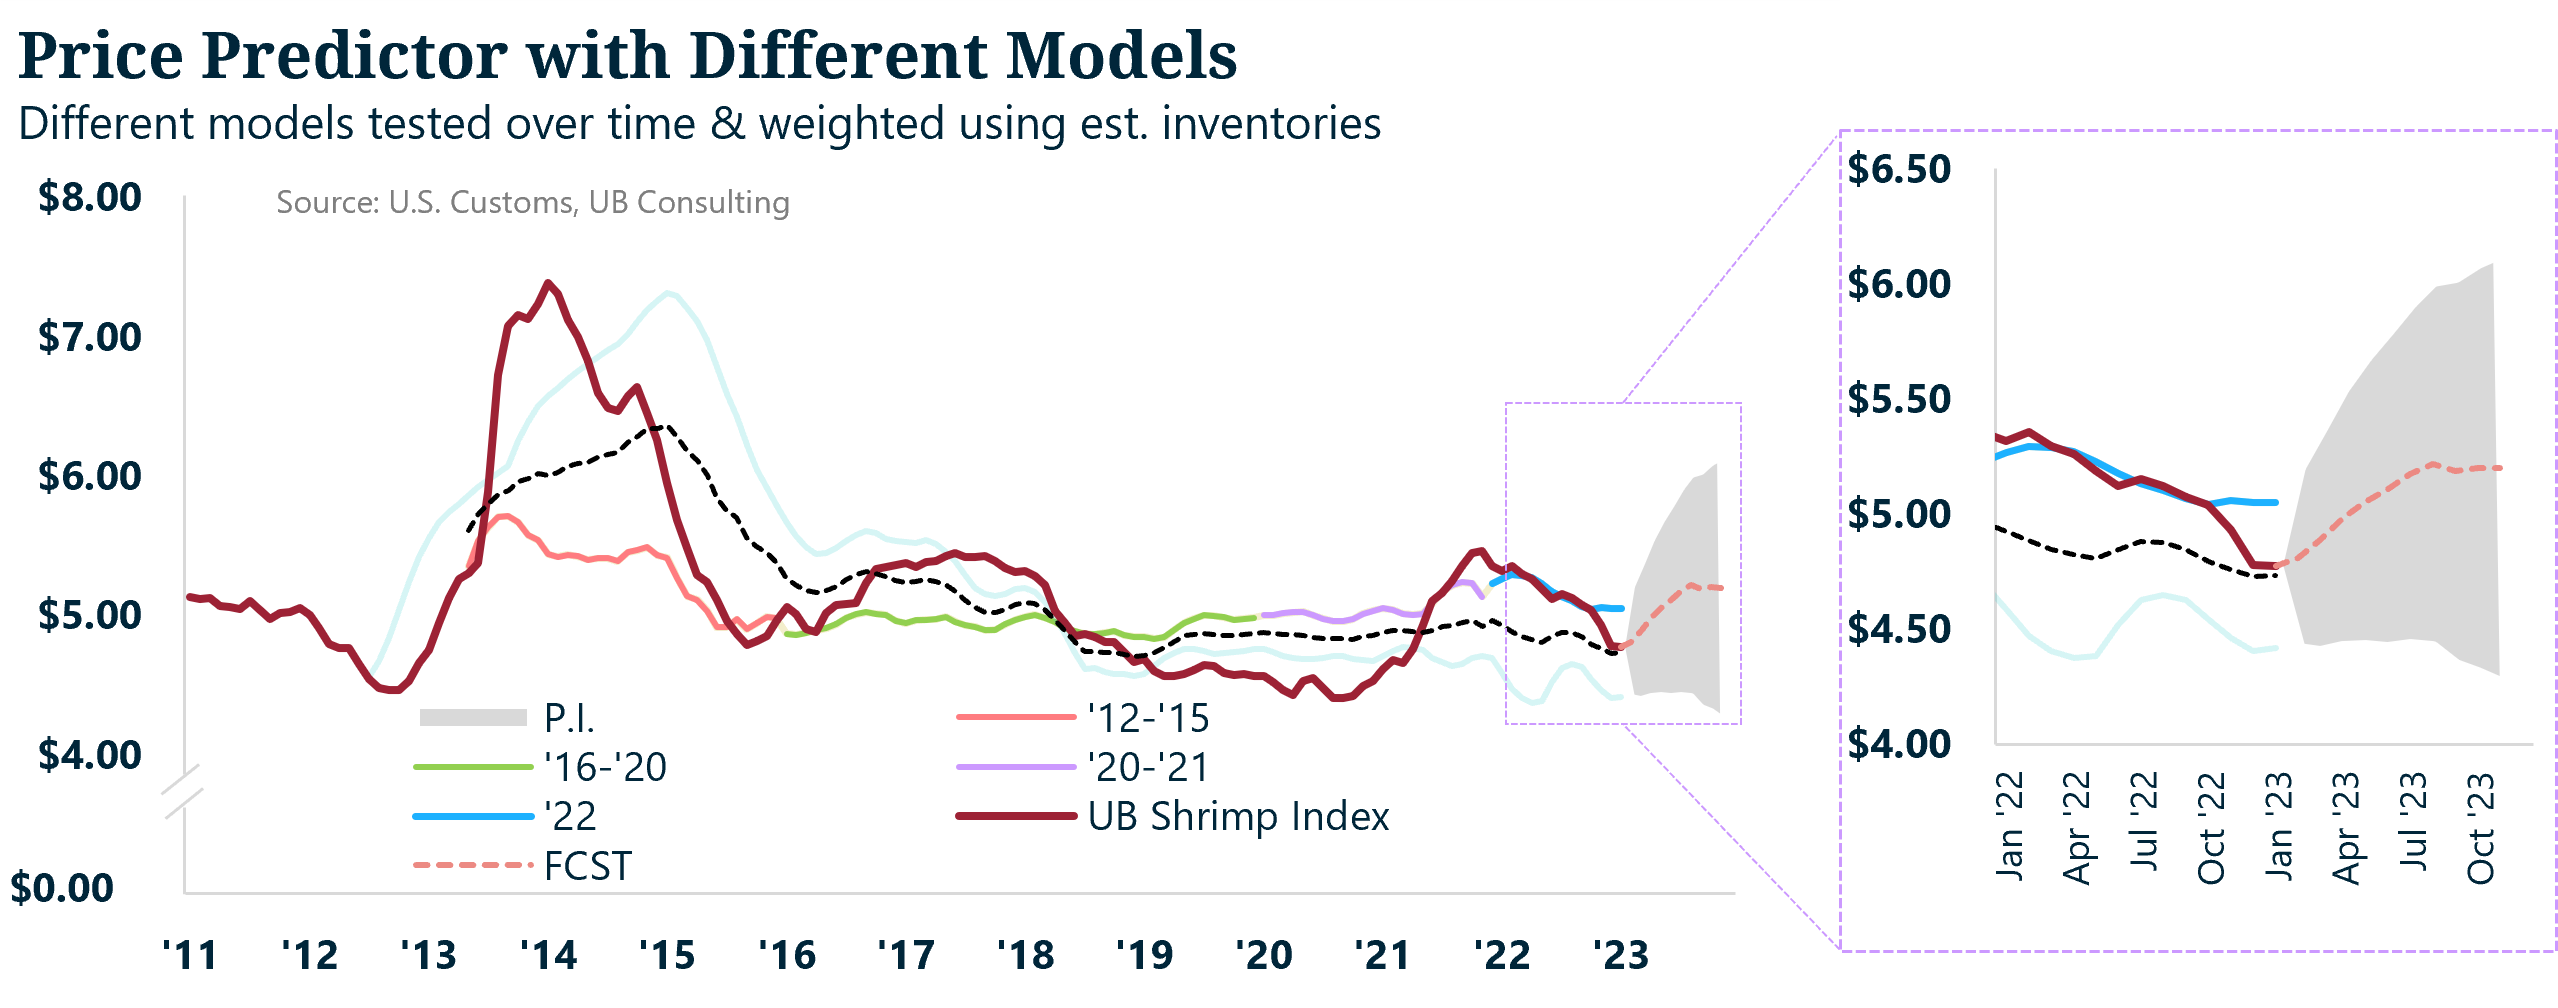
Figure 12. Price model using estimated inventories as a predictor. Source: U.S. Customs, Urner Barry Consulting.
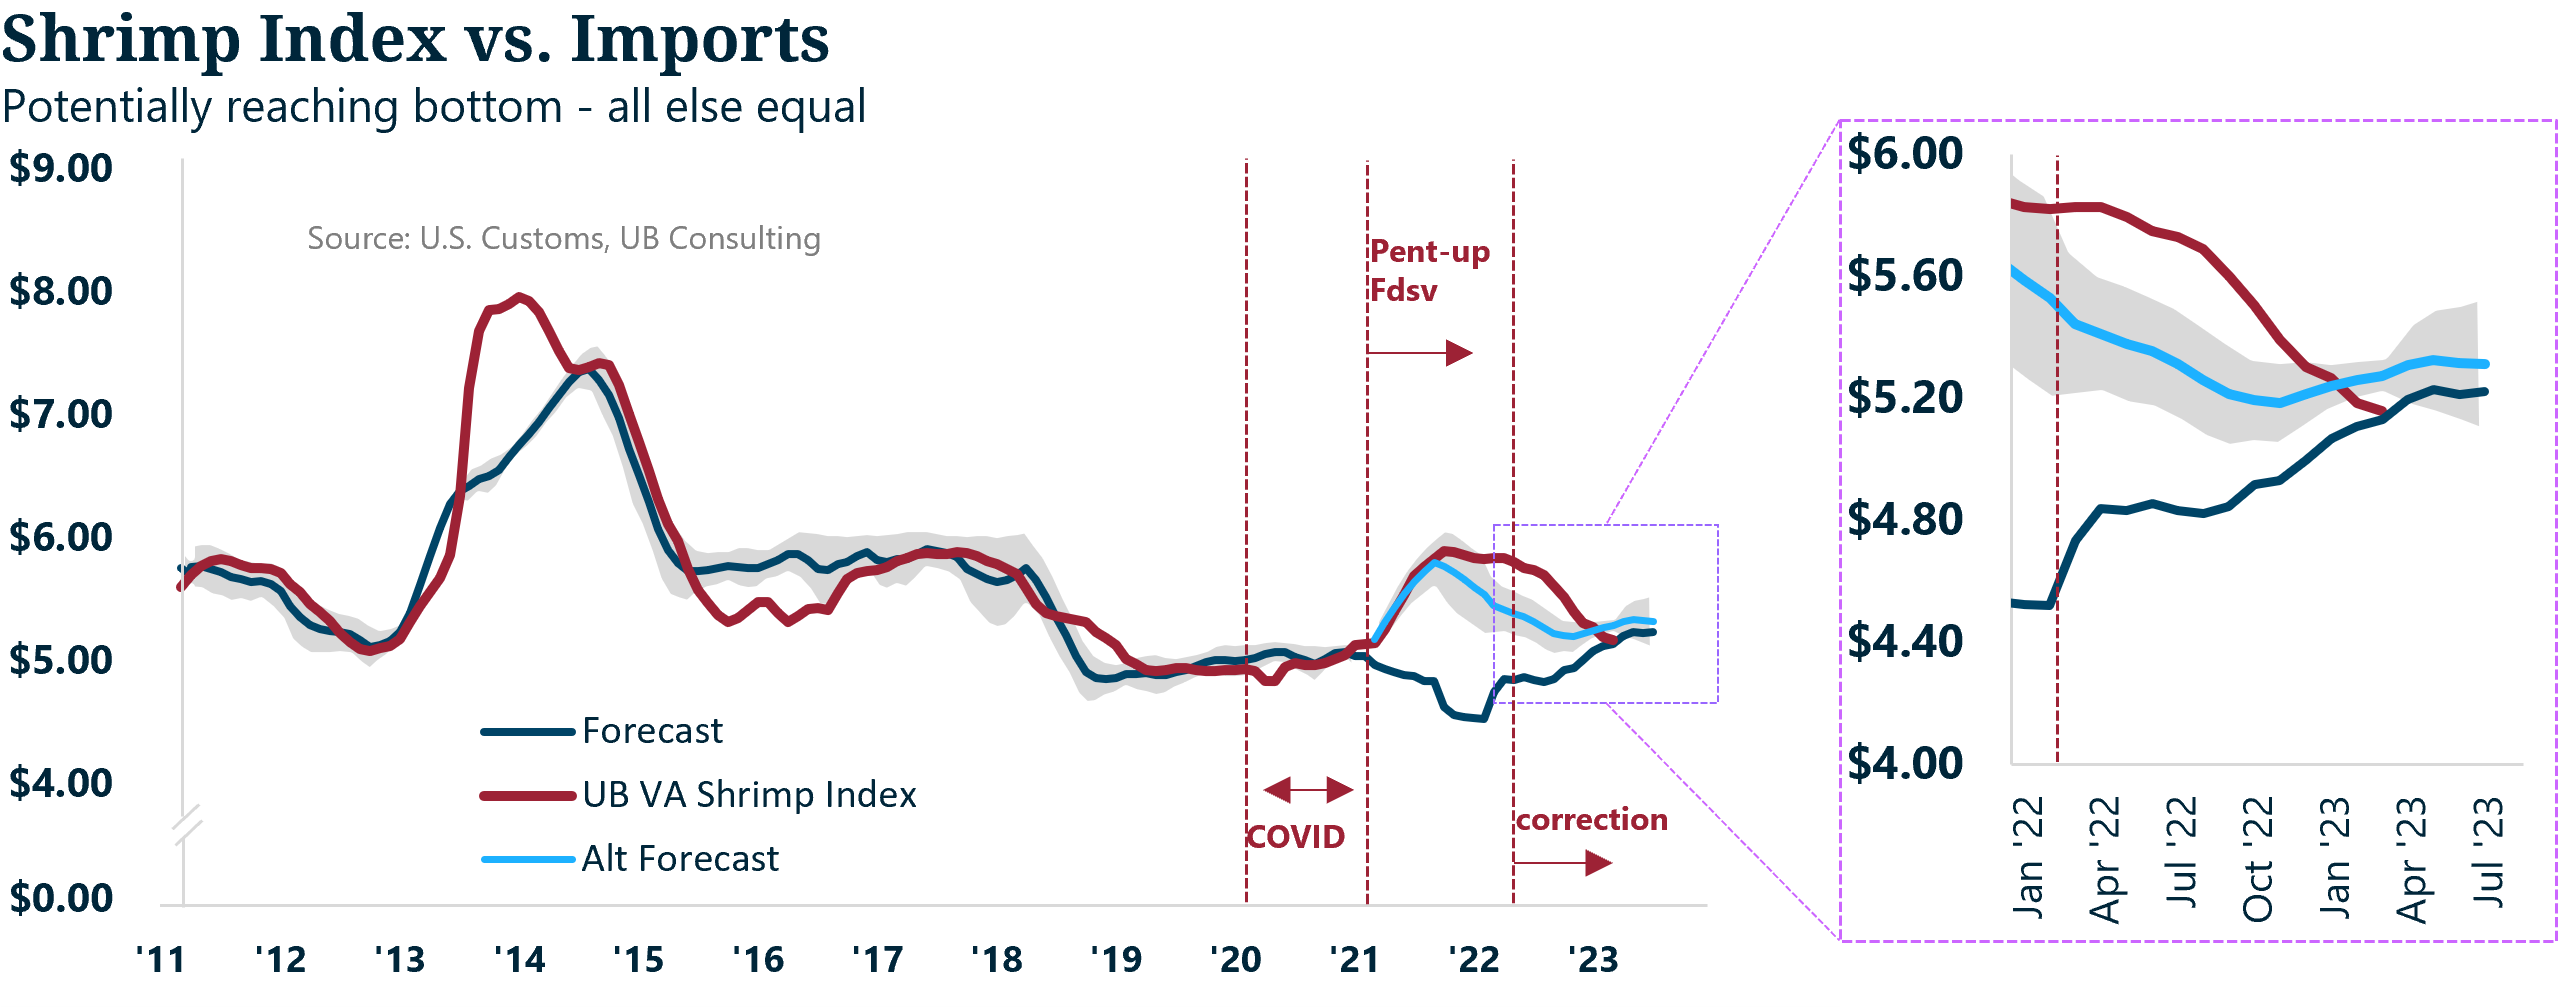
Figure 13. Price model using imports as a predictor. Source: U.S. Customs, Urner Barry Consulting.
Photo Credit: akepong srichaichana / Shutterstock.com
Angel Rubio
Urner Barry
1-732-240-5330
arubio@urnerbarry.com
Andrei Rjedkin
Urner Barry
1-732-240-5330 ext 293
arjedkin@urnerbarry.com