UB Consulting: Is the U.S. shrimp market still in correction mode?
Thursday, 30 June 2022Predicting a downward correction during inflationary times
Prices in the U.S. shrimp market have remained relatively steady compared to several other animal proteins, like beef, chicken, pork, and even salmon. Although wholesale shrimp prices managed to rise due to the recovery in foodservice that started around Q1 last year, a downward correction appeared inevitable into 2022 after imports continued their back-to-back month-over-month and year-over-year record-high levels. Official data and in-house estimates through May 2022 revealed a 12 percent year-over-year increase and a 31 percent increase compared to the 3-year average during the same period. Naturally, fundamentals suggest an expanding demand drove these increases, and as a result, one could foresee price imbalances. While fundamentals, in this case, are an oversimplification of the marketplace, we tried to look at some of the recent price moves in the market and make sense of what could lie ahead in the coming months.
Key findings:
- Shrimp prices have been correcting downward as explained by Urner Barry’s HSLO and VA shrimp indexes.
- The value-added (VA – peeled and cooked) shrimp market could be overvalued between 0.2 and 8.5 percent
- The headless shell-on (HSLO) shrimp market could be overvalued between 4.5 and 17 percent.
- From approximately February and March 2021 through about 2022, the market experienced a “random” event that forecasts were not able to capture fully;
- this could be attributed to the “pent-up” demand for food as a result from the resurgence of foodservice, in addition to an already robust retail demand and several other external factors.
- Still, retail shrimp prices, when adjusted for inflation, are lower compared to several other proteins.
- From March 2022 until now, shrimp prices appear to be following more “normal” historical patterns that can be explained by market fundamentals.

Figure 1. Year-to-date U.S. shrimp imports from January through May, all types. Source: U.S. Customs, Urner Barry Consulting.

Figure 2. Year-to-date percent change of U.S. shrimp imports from January through May, all types. Source: U.S. Customs, Urner Barry Consulting.
A simple approach
We looked at overall changes in imports relative to price. In this simple exercise, we trained our models and then tested them over the last 12 years. In some instances, we tried to correct the changes in VA and HSLO shrimp relative to total shrimp imports. We did this because, for example, the ratio of peeled and cooked shrimp to total shrimp has continuously increased over time and then increased its pace over the last 18 months. We heavily transformed the data, adjusted for time lags to price reactions, and elaborated predictive models.

Figure 3. Value-added shrimp (peeled and cooked) imports as a percentage of total shrimp imports. Source: U.S. Customs, Urner Barry Consulting.
The price variation results were remarkably accurate for only taking imports as our explanatory variable. Still, it is crucial to mention that no matter how accurate a model is, there will always be a considerable amount of variation that the model will not be able to explain. In other words, there will be variation that the model will not be able to account for due to random events, such as shocks to the market or buyer sentiment about the future.
In this exercise, we split the data into different time segments that would be able to explain supply and demand at different equilibrium points. In general, we found that the models for both the HSLO and VA were relatively informative until around February 2021 when there appeared to be a temporary structural break in the data. And while “temporary” and “structural” are generally not used in the same context, data suggests that such a price break appeared to have been in correction mode since about March 2022. In other words, from around February 2021 through March 2022, the market went through a “random” event in which the model could not explain price variation using imports just like it did for the past 12 years, including the supply shock of 2013 caused by Early Mortality Syndrome (EMS). Thus, we tried to adjust for such “pent-up” demand caused by the resurgence of foodservice during Q1 2021 amid record-high shrimp imports. In other words, different from the model, which suggests a negative correlation between imports and price, we observed two different results when combined.

Figure 4. Example of one of the forecast models performed. Urner Barry’s HSLO shrimp index and in-house simple forecast model utilizing imports. Source: U.S. Customs, Urner Barry Consulting.
Results
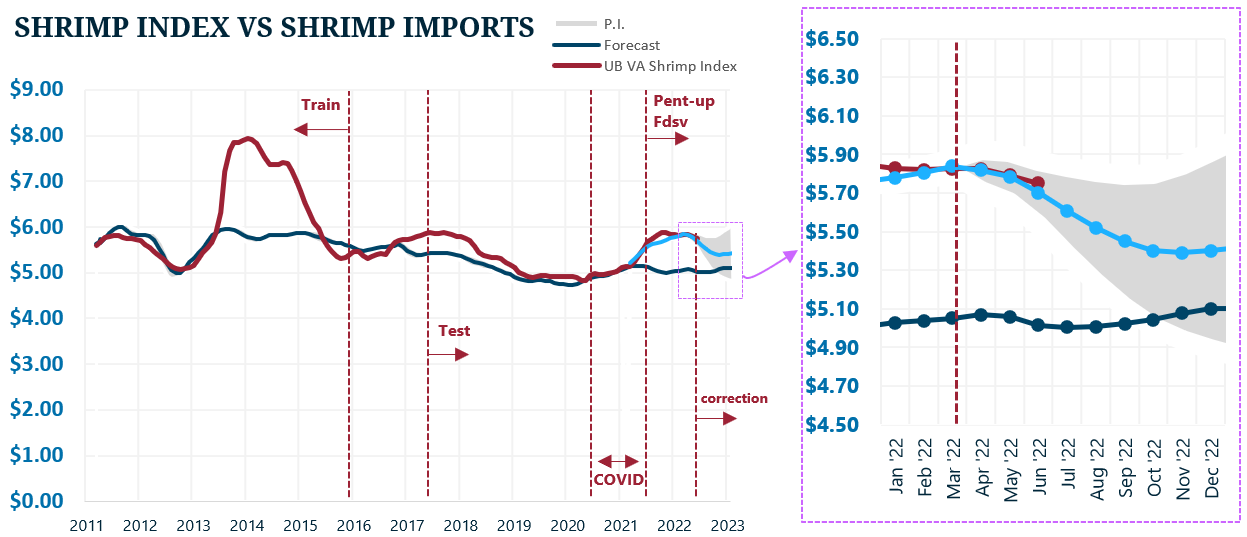
For HSLO shrimp, the model was less accurate than that for VA shrimp. Empirically this would make sense if we assume that demand for value-added was more robust than for shell-on shrimp over time. And this was true when analyzing price variation for VA shrimp, in which the relative volume of both peeled and cooked to total shrimp couldn’t explain the EMS price surge in 2013, but performed relatively well from November 2016 through March 2021, showing a strong negative correlation. When we looked at times when the relationship between the proportion of value-added shrimp relative to total imports and price variation was positive, it yielded interesting results. We applied those results to the period from around February 2021 until now and noticed that the model resembles more or less the trend over the last several months. With that, the model suggests that VA index could be overvalued between 1.6 and 8.5 percent and, as a result, could continue to adjust lower in the upcoming months.

Figure 5. Transformed price and import data using Urner Barry’s VA shrimp index and the ratio of value-added shrimp imports to total shrimp imports. Source: U.S. Customs, Urner Barry Consulting.

Figure 6. VA shrimp index model uses value-added shrimp imports to total shrimp imports. Source: U.S. Customs, Urner Barry Consulting.
Figure 7. VA shrimp index model uses value-added shrimp imports to total shrimp imports from January 2022. Source: U.S. Customs, Urner Barry Consulting.
Results – Value-Added (VA) Shrimp
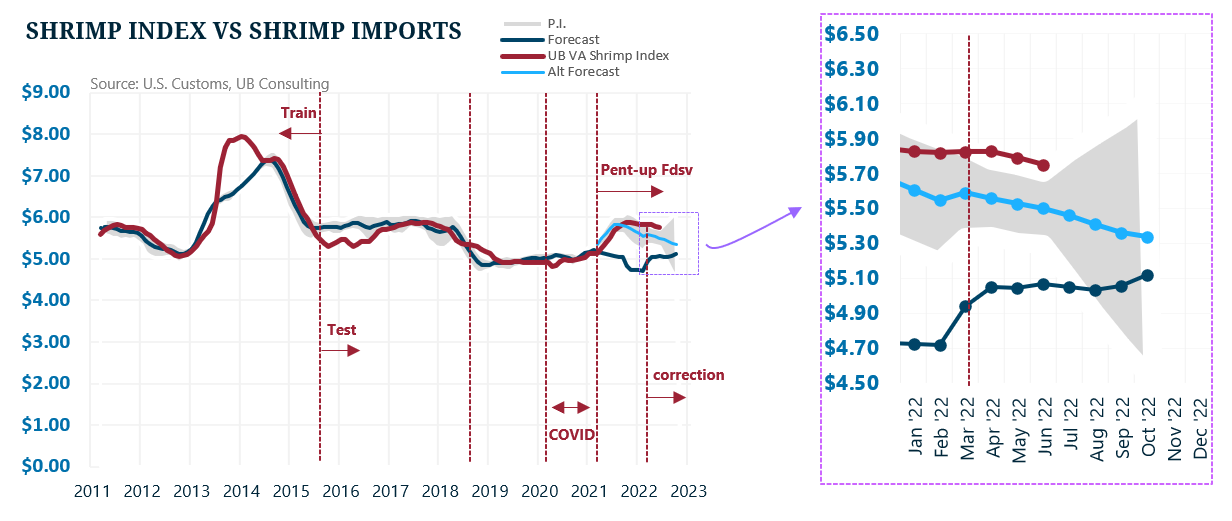
We continued testing VA shrimp pricing utilizing actual volume instead of a ratio. The results were more accurate after adjusting for a structural break as we approached 2019, in which the surge in VA shrimp imports throughout 2018 and into 2019 did not cause prices to fall in the expected magnitude. In other words, while prices fell due to the surge in VA shrimp imports, they fell less than expected due to a structural increase in demand for value-added shrimp. This result could be due to several reasons, such as major national programs switching to more value-added products or increased demand for value-added shrimp due to relatively steady and low prices. We made such an assumption and adjusted the model to reflect such change. Although less accurate than the previous model, the results yielded similar outcomes. However, beyond 2021, negatively correlated models would have suggested a dramatic price drop, all else equal. But similar to the previous model, from approximately March 2021 to about March 2022, prices increased while imports surged, resulting in a positive correlation. Therefore, we adjusted the model to reflect such behavior combined with what a negative correlation would have otherwise suggested. Again, the new model yielded similar results, suggesting that VA shrimp prices could be overvalued between 0.2 and 7 percent and could continue to adjust lower, albeit at a gradual and relatively slow rate.

Figure 8. Transformed price and import data using Urner Barry’s VA shrimp index and value-added imports. Source: U.S. Customs, Urner Barry Consulting.

Figure 9. VA shrimp index model uses value-added shrimp imports. Source: U.S. Customs, Urner Barry Consulting.
Figure 10. VA shrimp index model uses value-added shrimp imports from January 2022. Source: U.S. Customs, Urner Barry Consulting.
Results – Headless, Shell-on (HSLO) Shrimp
The HSLO market was slightly more challenging. While we followed a similar methodology, the confidence in the forecast past March 2021 dropped significantly. And that is because, before March 2021, most observations since December 2010 showed a negative correlation between volume and price. On the one hand, this is highly informative, and as the charts below show, the model showed a relatively good result that includes both supply (EMS) and demand (COVID) shocks. However, utilizing the same methodology, no historical relationship would have suggested the price behavior seen past March 2021 whether we utilized shell-on shrimp imports, total shrimp imports, or a ratio of the two to explain price changes. Therefore, we had no alternative but to test fewer observations that would yield positive correlations, transform them, and then adapt them to a seemingly temporary threshold change.

Figure 11. Transformed Urner Barry’s HSLO shrimp index relationship with shell-on imports. Source: U.S. Customs, Urner Barry Consulting.
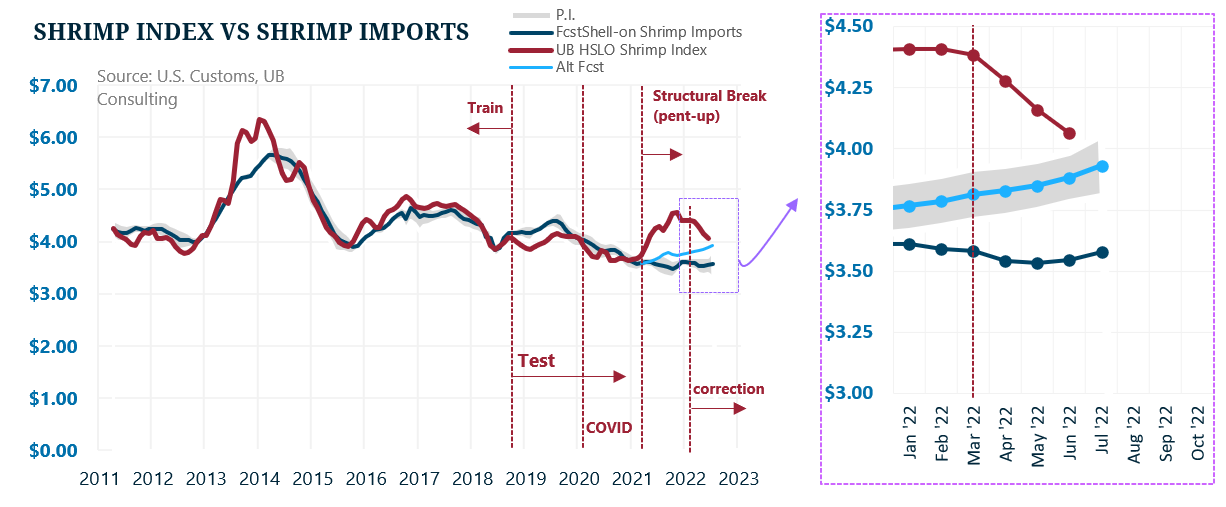
Historically, both models performed moderately well in the train and test datasets, but both models were weak beyond March 2021. Still, we chose the model that performed best based on a judgment call, which appeared more closely with what we have collected anecdotally. The predicted range for HSLO was much wider based on the different models analyzed, but the results suggest the HSLO market could be overvalued as low as 4.5 percent and as high as 17 percent.

Figure 12. Transformed price and import data using Urner Barry’s HSLO shrimp index and shell-on shrimp imports. Source: U.S. Customs, Urner Barry Consulting.

Figure 13. HSLO shrimp index model uses shell-on shrimp imports. Source: U.S. Customs, Urner Barry Consulting.
Figure 14. HSLO shrimp index model uses shell-on shrimp imports from January 2022. Source: U.S. Customs, Urner Barry Consulting.
Limitations
It is essential to mention that the model exposes its inherent limitations by only using imports as the only factor affecting price. As a result, it becomes hard to gauge any potential price movement based on other factors that the model does not control, such as the growing presence of Ecuadorean shrimp in the peeled market at competitive prices compared to shrimp of Asian origin, or the negative impacts on feed costs caused by the Russian invasion of Ukraine. However, imports are a statistically significant component and highly informative in explaining price movement. Therefore, this model could help analyze potential trading positions given that external factors will directly and indirectly affect the supply side of the equation.
Conclusions
Whether shrimp prices are poised to continue dropping or settling at current levels, as explained by the models, we must consider the long-term positive effects on shrimp demand due to overall price stability. These positives include relative price stability over the last two years compared to other proteins, including salmon. Even in the current inflationary environment, shrimp prices to the consumer have decreased when adjusted for inflation, which could, in turn, continue to support a strong demand.

Figure 15. Average retail feature price for several animal proteins, adjusted for inflation. Bacon, ground beef, eggs, and chicken breasts use average retail price from the USDA. Source: Urner Barry, USDA.
Still, given the expected production increases out of Ecuador and India in 2022, it does not appear that U.S. demand will grow at the same pace, particularly after experiencing fast expansion just the year prior (2021). Therefore, it is not unreasonable to continue seeing downward pressure on wholesale shrimp prices. For now and from the sidelines, we hope the shrimp industry can maintain healthy margins despite a gradual downward price correction.
Angel Rubio
Urner Barry
1-732-240-5330
arubio@urnerbarry.com
Akash Pandey
Urner Barry
1-732-240-5330
apandey@urnerbarry.com
Andrei Rjedkin
Urner Barry
1-732-240-5330 ext 293
arjedkin@urnerbarry.com
